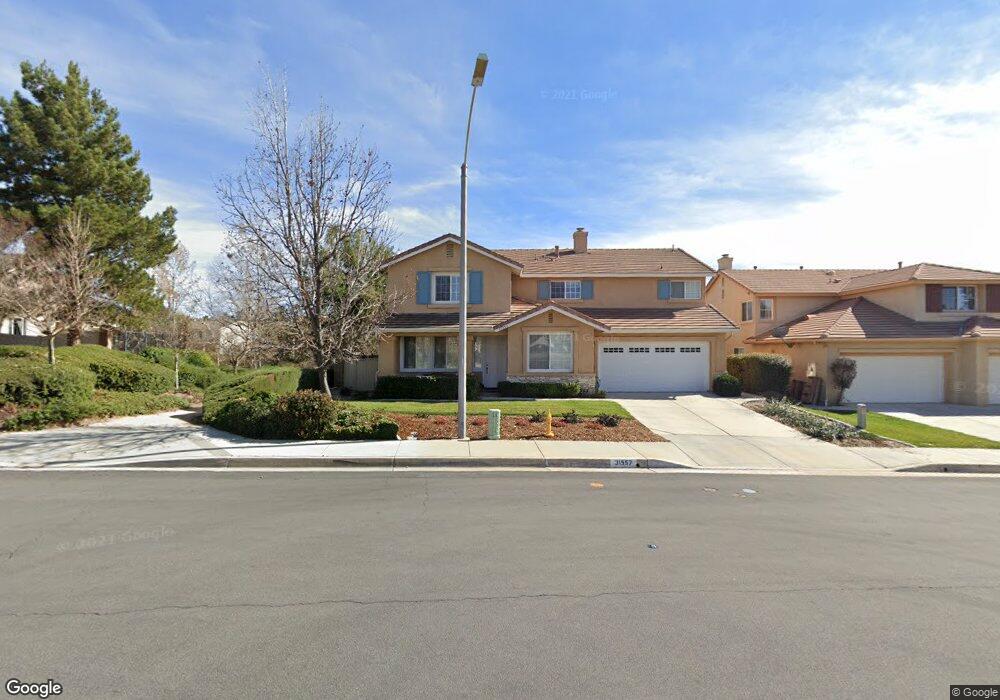
31557 Culbertson Ln Temecula, CA 92591
Chardonnay Hills NeighborhoodEstimated Value: $799,562 - $823,000
5
Beds
3
Baths
2,867
Sq Ft
$282/Sq Ft
Est. Value
About This Home
This home is located at 31557 Culbertson Ln, Temecula, CA 92591 and is currently estimated at $809,391, approximately $282 per square foot. 31557 Culbertson Ln is a home located in Riverside County with nearby schools including Rancho Elementary School, Margarita Middle School, and Temecula Valley High School.
Ownership History
Date
Name
Owned For
Owner Type
Purchase Details
Closed on
Jan 9, 2025
Sold by
Bridgham Revocable Trust and Rhoads-Bridgham Karin
Bought by
Williams Richard A and Williams Denise
Current Estimated Value
Home Financials for this Owner
Home Financials are based on the most recent Mortgage that was taken out on this home.
Original Mortgage
$706,500
Outstanding Balance
$701,688
Interest Rate
6.91%
Mortgage Type
New Conventional
Estimated Equity
$107,703
Purchase Details
Closed on
Mar 10, 2014
Sold by
Bridgham Dennis and Rhoads Bridgham Karin
Bought by
Bridgham Dennis and Rhoads Bridgham Karin
Purchase Details
Closed on
Apr 18, 2000
Sold by
Lennar Homes Of California Inc
Bought by
Bridgham Dennis and Rhoads Bridgham Karin
Home Financials for this Owner
Home Financials are based on the most recent Mortgage that was taken out on this home.
Original Mortgage
$200,000
Interest Rate
8.16%
Create a Home Valuation Report for This Property
The Home Valuation Report is an in-depth analysis detailing your home's value as well as a comparison with similar homes in the area
Home Values in the Area
Average Home Value in this Area
Purchase History
| Date | Buyer | Sale Price | Title Company |
|---|---|---|---|
| Williams Richard A | $785,000 | Fidelity National Title | |
| Bridgham Dennis | -- | None Available | |
| Bridgham Dennis | $255,500 | North American Title Co |
Source: Public Records
Mortgage History
| Date | Status | Borrower | Loan Amount |
|---|---|---|---|
| Open | Williams Richard A | $706,500 | |
| Previous Owner | Bridgham Dennis | $200,000 |
Source: Public Records
Tax History Compared to Growth
Tax History
| Year | Tax Paid | Tax Assessment Tax Assessment Total Assessment is a certain percentage of the fair market value that is determined by local assessors to be the total taxable value of land and additions on the property. | Land | Improvement |
|---|---|---|---|---|
| 2025 | $4,561 | $384,217 | $67,793 | $316,424 |
| 2023 | $4,561 | $369,299 | $65,161 | $304,138 |
| 2022 | $4,418 | $362,059 | $63,884 | $298,175 |
| 2021 | $4,323 | $354,961 | $62,632 | $292,329 |
| 2020 | $4,275 | $351,322 | $61,990 | $289,332 |
| 2019 | $4,211 | $344,434 | $60,775 | $283,659 |
| 2018 | $4,126 | $337,682 | $59,584 | $278,098 |
| 2017 | $4,051 | $331,062 | $58,416 | $272,646 |
| 2016 | $3,973 | $324,571 | $57,271 | $267,300 |
| 2015 | $3,901 | $319,697 | $56,411 | $263,286 |
| 2014 | -- | $313,437 | $55,307 | $258,130 |
Source: Public Records
Map
Nearby Homes
- 31425 Culbertson Ln
- 31492 Britton Cir
- 41128 Vintage Cir
- 31716 Weibel Cir
- 0 Vista Del Monte Rd Unit SW24075540
- 39508 S Fiesta Ranch Rd
- 39514 S Fiesta Ranch Rd
- 39220 Valley Vista
- 54740 Cave Rock
- 32135 Roripaugh Valley
- 39502 S Fiesta Ranch Rd
- 32040 S Fiesta Ranch Rd
- 32047 S Fiesta Ranch Rd
- 31939 Calle Elenita
- 41152 Promenade Chardonnay Hills
- 31461 Congressional Dr
- 32186 Placer Belair
- 41657 Cypress Point Way
- 31345 Avenida Del Reposo
- 41686 Monterey Place
- 31545 Culbertson Ln
- 31599 Sonoma Ln
- 31577 Culbertson Ln
- 31533 Culbertson Ln
- 31550 Culbertson Ln
- 31580 Culbertson Ln
- 31521 Culbertson Ln
- 31585 Culbertson Ln
- 31540 Culbertson Ln
- 31588 Culbertson Ln
- 31530 Culbertson Ln
- 31509 Culbertson Ln
- 31593 Culbertson Ln
- 41065 Cour Citran
- 31507 Sonoma Ln
- 31434 Chemin Chevalier
- 31596 Culbertson Ln
- 31508 Sonoma Ln
- 41058 Cour Citran
- 31520 Culbertson Ln