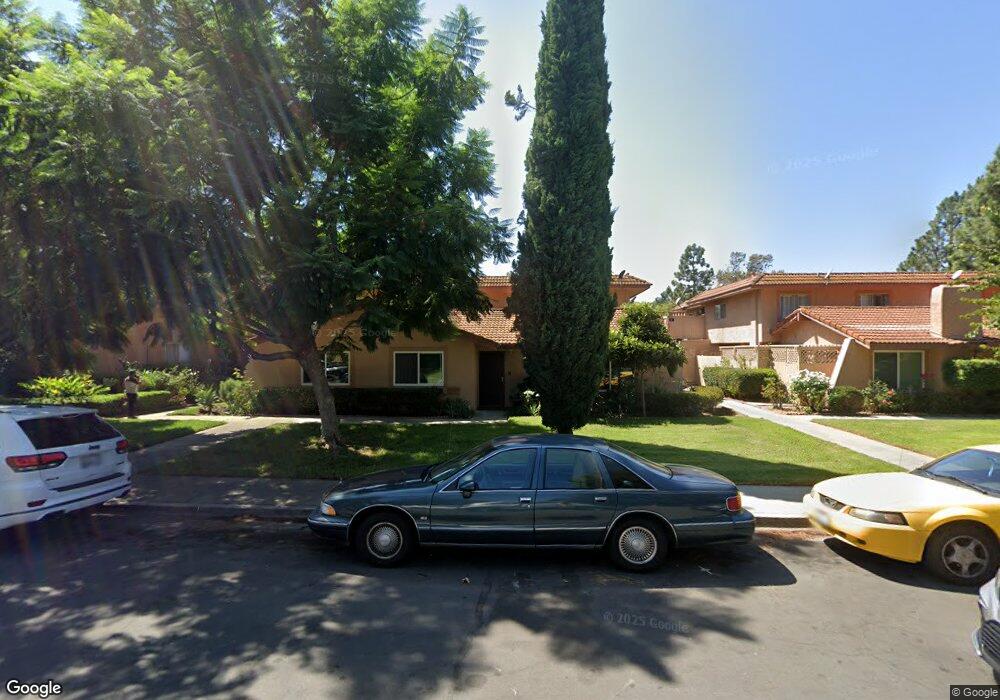
31571 Calle la Purisima Unit 22 San Juan Capistrano, CA 92675
Estimated Value: $550,000 - $587,000
2
Beds
2
Baths
1,124
Sq Ft
$508/Sq Ft
Est. Value
About This Home
This home is located at 31571 Calle la Purisima Unit 22, San Juan Capistrano, CA 92675 and is currently estimated at $571,031, approximately $508 per square foot. 31571 Calle la Purisima Unit 22 is a home located in Orange County with nearby schools including Kinoshita Elementary School, Marco Forster Middle School, and San Juan Hills High School.
Ownership History
Date
Name
Owned For
Owner Type
Purchase Details
Closed on
Mar 15, 2001
Sold by
Perez Martin and Flores Jose
Bought by
Perez Martin
Current Estimated Value
Home Financials for this Owner
Home Financials are based on the most recent Mortgage that was taken out on this home.
Original Mortgage
$82,500
Interest Rate
7.06%
Purchase Details
Closed on
Dec 17, 1997
Sold by
Fidelity Federal Bank Fsb
Bought by
Perez Martin and Flores Jose
Home Financials for this Owner
Home Financials are based on the most recent Mortgage that was taken out on this home.
Original Mortgage
$82,150
Interest Rate
7.16%
Mortgage Type
FHA
Purchase Details
Closed on
Aug 29, 1997
Sold by
Jackle Paul H and Jackle Karen D
Bought by
Fidelity Federal Bank Fsb
Purchase Details
Closed on
Feb 24, 1994
Sold by
Jackle Paul and Jackle Karen D
Bought by
June Coast Properties L P
Create a Home Valuation Report for This Property
The Home Valuation Report is an in-depth analysis detailing your home's value as well as a comparison with similar homes in the area
Home Values in the Area
Average Home Value in this Area
Purchase History
| Date | Buyer | Sale Price | Title Company |
|---|---|---|---|
| Perez Martin | -- | Lawyers Title Company | |
| Perez Martin | $84,000 | Fidelity National Title Ins | |
| Fidelity Federal Bank Fsb | $100,342 | American Title Co | |
| June Coast Properties L P | -- | -- |
Source: Public Records
Mortgage History
| Date | Status | Borrower | Loan Amount |
|---|---|---|---|
| Closed | Perez Martin | $82,500 | |
| Closed | Perez Martin | $82,150 |
Source: Public Records
Tax History Compared to Growth
Tax History
| Year | Tax Paid | Tax Assessment Tax Assessment Total Assessment is a certain percentage of the fair market value that is determined by local assessors to be the total taxable value of land and additions on the property. | Land | Improvement |
|---|---|---|---|---|
| 2025 | $1,786 | $175,545 | $78,560 | $96,985 |
| 2024 | $1,786 | $172,103 | $77,019 | $95,084 |
| 2023 | $1,750 | $168,729 | $75,509 | $93,220 |
| 2022 | $1,719 | $165,421 | $74,028 | $91,393 |
| 2021 | $1,687 | $162,178 | $72,577 | $89,601 |
| 2020 | $1,672 | $160,516 | $71,833 | $88,683 |
| 2019 | $1,642 | $157,369 | $70,424 | $86,945 |
| 2018 | $1,612 | $154,284 | $69,043 | $85,241 |
| 2017 | $1,598 | $151,259 | $67,689 | $83,570 |
| 2016 | $1,568 | $148,294 | $66,362 | $81,932 |
| 2015 | $1,544 | $146,067 | $65,365 | $80,702 |
| 2014 | $1,517 | $143,206 | $64,084 | $79,122 |
Source: Public Records
Map
Nearby Homes
- 31608 Los Rios St Unit 147
- 31377 Los Rios St Unit 64
- 31284 Calle San Juan Unit 14
- 31278 Calle San Juan Unit 12
- 0 Aguacate Rd Unit 25558127
- 31527 Aguacate Rd
- 26468 Calle San Antonio
- 32011 Via Tonada Unit 9
- 26447 Paseo Carmel Unit 11D
- 31024 Calle San Diego Unit 94b
- 32165 Paseo Carolina Unit 207
- 27281 Calle de la Rosa
- 32221 Alipaz St Unit 132
- 32221 Alipaz St Unit 268
- 31872 Paseo Cielo
- 27381 Via Priorato
- 31980 Via Refrescar
- 31892 Paseo Cielo
- 32302 Alipaz St Unit 312
- 32302 Alipaz St Unit 230
- 31575 Calle la Purisima Unit 24
- 31573 Calle la Purisima Unit 23
- 31577 Calle la Purisima
- 31583 Calle la Purisima
- 31561 Calle la Purisima Unit 26
- 31581 Calle la Purisima Unit 18
- 31581 Calle la Purisima
- 31567 Calle la Purisima
- 31587 Calle la Purisima Unit 21
- 31585 Calle la Purisima Unit 20
- 31585 Calle la Purisima
- 31563 Calle la Purisima Unit 27
- 31578 Avenida de la Vista
- 31586 Avenida de la Vista Unit 11
- 31586 Avenida de la Vista Unit 11
- 31591 Calle la Purisima Unit 17
- 31584 Avenida de la Vista Unit 10
- 31572 Calle la Purisima
- 31594 Avenida de la Vista Unit 14
- 31594 Avenida de la Vista Unit 14