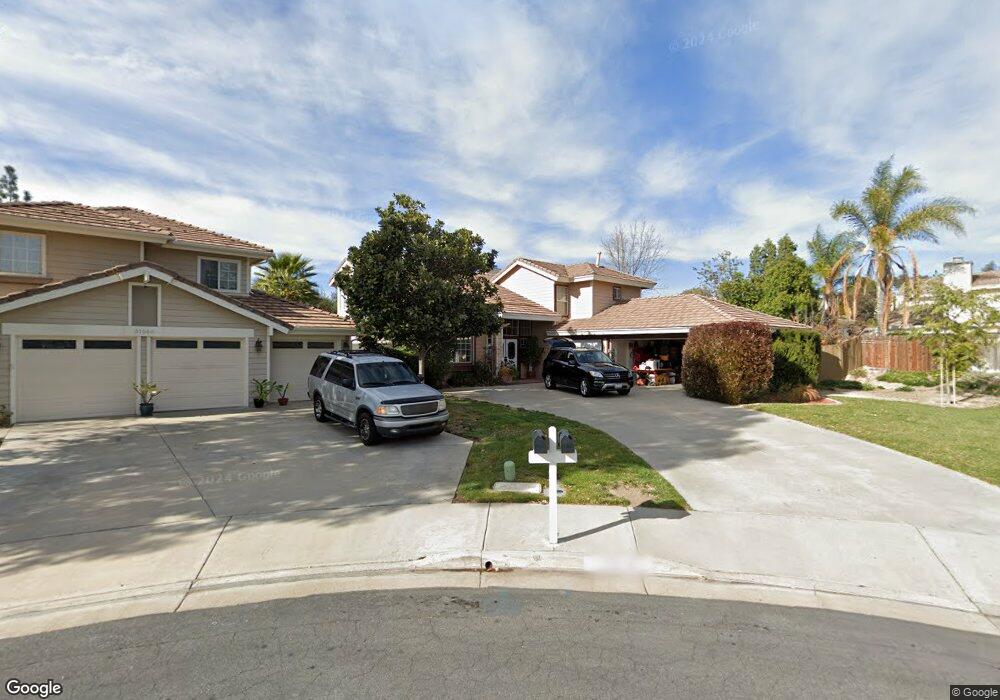
31578 Corte Pacheco Temecula, CA 92592
Margarita Village-Temeku Hills NeighborhoodEstimated Value: $811,260 - $876,000
5
Beds
4
Baths
2,741
Sq Ft
$309/Sq Ft
Est. Value
About This Home
This home is located at 31578 Corte Pacheco, Temecula, CA 92592 and is currently estimated at $847,815, approximately $309 per square foot. 31578 Corte Pacheco is a home located in Riverside County with nearby schools including Vintage Hills Elementary School, Temecula Middle School, and Temecula Valley High School.
Ownership History
Date
Name
Owned For
Owner Type
Purchase Details
Closed on
Jun 29, 2021
Sold by
Baker Gregory and Baker Georganna
Bought by
Baker Gregory and Baker Georganna
Current Estimated Value
Purchase Details
Closed on
Feb 7, 2005
Sold by
Baker Gregory C
Bought by
Baker Gregory C and Baker Georganna S
Home Financials for this Owner
Home Financials are based on the most recent Mortgage that was taken out on this home.
Original Mortgage
$250,000
Interest Rate
5.66%
Mortgage Type
Stand Alone Refi Refinance Of Original Loan
Purchase Details
Closed on
Nov 7, 2002
Sold by
Baker Gregory C and Baker Georganna S
Bought by
Baker Gregory C
Home Financials for this Owner
Home Financials are based on the most recent Mortgage that was taken out on this home.
Original Mortgage
$217,500
Interest Rate
7%
Mortgage Type
Purchase Money Mortgage
Create a Home Valuation Report for This Property
The Home Valuation Report is an in-depth analysis detailing your home's value as well as a comparison with similar homes in the area
Home Values in the Area
Average Home Value in this Area
Purchase History
We collect this data history from publicly available records. To have your information removed, we recommend requesting removal directly through your county’s website.
| Date | Buyer | Sale Price | Title Company |
|---|---|---|---|
| Baker Gregory | -- | None Available | |
| Baker Gregory | -- | None Available | |
| Baker Gregory C | -- | Stewart Title Riverside | |
| Baker Gregory C | -- | Old Republic Title Company |
Source: Public Records
Mortgage History
We collect this data history from publicly available records. To have your information removed, we recommend requesting removal directly through your county’s website.
| Date | Status | Borrower | Loan Amount |
|---|---|---|---|
| Closed | Baker Gregory C | $250,000 | |
| Closed | Baker Gregory C | $217,500 |
Source: Public Records
Tax History
| Year | Tax Paid | Tax Assessment Tax Assessment Total Assessment is a certain percentage of the fair market value that is determined by local assessors to be the total taxable value of land and additions on the property. | Land | Improvement |
|---|---|---|---|---|
| 2025 | $5,714 | $473,552 | $117,724 | $355,828 |
| 2023 | $5,714 | $455,164 | $113,153 | $342,011 |
| 2022 | $5,538 | $446,240 | $110,935 | $335,305 |
| 2021 | $5,424 | $437,491 | $108,760 | $328,731 |
| 2020 | $5,365 | $433,006 | $107,645 | $325,361 |
| 2019 | $5,286 | $424,517 | $105,535 | $318,982 |
| 2018 | $5,183 | $416,194 | $103,467 | $312,727 |
| 2017 | $5,091 | $408,035 | $101,439 | $306,596 |
| 2016 | $4,994 | $400,035 | $99,450 | $300,585 |
| 2015 | $4,907 | $394,028 | $97,957 | $296,071 |
| 2014 | $4,762 | $386,311 | $96,039 | $290,272 |
Source: Public Records
Map
Nearby Homes
- 41848 Cascades Ct
- 42075 Dunes Ct
- 0 Green Tree Rd Unit 178 250037799
- 42939 Cala Rosso
- 42343 Camino Romo
- 31060 Corte Anza
- 30874 Crystalaire Dr
- 32097 Cala Gerona
- 43026 Camino Casillas
- 41783 Niblick Rd
- 41844 Driver Ln
- 31921 Camino Marea
- 32000 Calle Espinosa
- 32038 Calle Marquis
- 42891 Camino Alagon
- 32163 Cala Torrente
- 43115 Corte Landeros
- 31874 Camino Marea
- 38100 Pauba Rd
- 41606 Slice Way
- 31566 Corte Pacheco
- 31390 Paseo Goleta
- 31380 Paseo Goleta
- 31556 Corte Pacheco
- 31400 Paseo Goleta
- 41732 Via el Greco
- 31370 Paseo Goleta
- 31577 Corte Pacheco
- 31542 Corte Pacheco
- 31412 Paseo Goleta
- 31565 Corte Pacheco
- 31364 Paseo Goleta
- 31555 Corte Pacheco
- 41778 Via el Greco
- 31534 Corte Pacheco
- 41788 Via el Greco
- 31541 Corte Pacheco
- 31381 Paseo Goleta
- 31393 Paseo Goleta
- 41798 Via el Greco
Your Personal Tour Guide
Ask me questions while you tour the home.