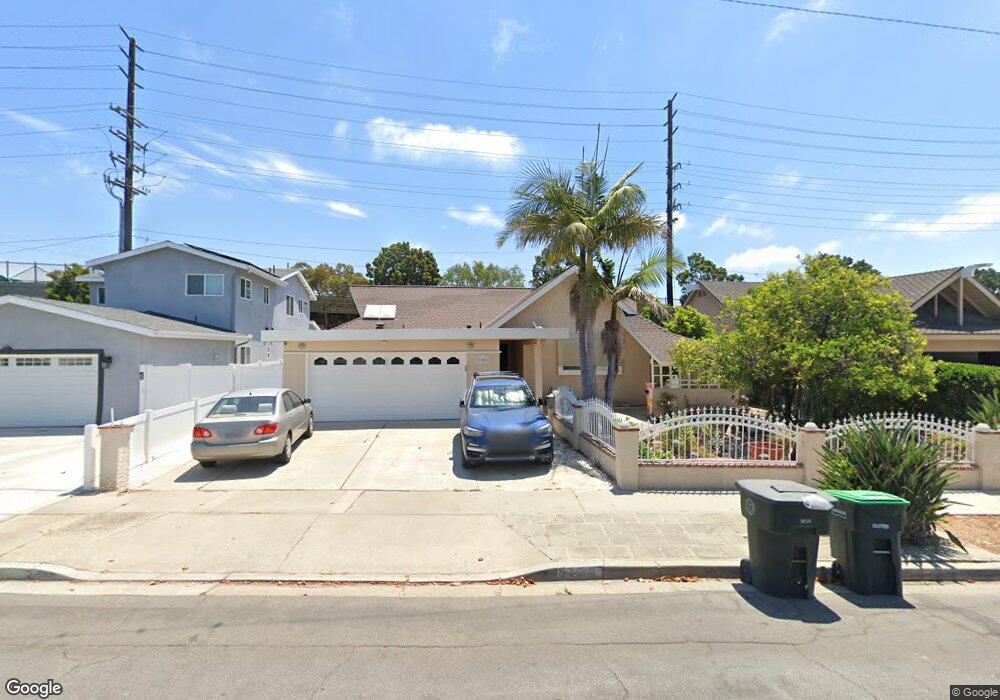
3158 Bray Ln Costa Mesa, CA 92626
Harbor Gateway NeighborhoodEstimated Value: $1,263,000 - $1,398,615
4
Beds
2
Baths
1,606
Sq Ft
$830/Sq Ft
Est. Value
About This Home
This home is located at 3158 Bray Ln, Costa Mesa, CA 92626 and is currently estimated at $1,332,904, approximately $829 per square foot. 3158 Bray Ln is a home located in Orange County with nearby schools including Killybrooke Elementary School, Costa Mesa High School, and California Pacific Charter - San Diego.
Ownership History
Date
Name
Owned For
Owner Type
Purchase Details
Closed on
Feb 21, 2025
Sold by
Tu Tam Minh
Bought by
Tam Minh Tu Family Trust and Tu
Current Estimated Value
Purchase Details
Closed on
Mar 8, 2022
Sold by
Thanh Tu Phuong
Bought by
Tu Tam Minh
Purchase Details
Closed on
Mar 3, 2022
Sold by
Minh Tu Tam
Bought by
Tu Tam Minh
Purchase Details
Closed on
Nov 8, 2010
Sold by
Tu Tam
Bought by
Tu Tam and Tu Phuong Thanh
Home Financials for this Owner
Home Financials are based on the most recent Mortgage that was taken out on this home.
Original Mortgage
$360,000
Interest Rate
4.27%
Mortgage Type
New Conventional
Purchase Details
Closed on
Jan 15, 2004
Sold by
Coreas Ricardo
Bought by
Tu Tam
Home Financials for this Owner
Home Financials are based on the most recent Mortgage that was taken out on this home.
Original Mortgage
$412,000
Interest Rate
5.79%
Mortgage Type
Purchase Money Mortgage
Create a Home Valuation Report for This Property
The Home Valuation Report is an in-depth analysis detailing your home's value as well as a comparison with similar homes in the area
Home Values in the Area
Average Home Value in this Area
Purchase History
| Date | Buyer | Sale Price | Title Company |
|---|---|---|---|
| Tam Minh Tu Family Trust | -- | None Listed On Document | |
| Tu Tam Minh | -- | -- | |
| Tu Tam Minh | -- | None Listed On Document | |
| Tu Tam Minh | -- | -- | |
| Tu Tam | -- | Lsi | |
| Tu Tam | $515,000 | North American Title Co | |
| Coreas Ricardo | -- | North American Title Co |
Source: Public Records
Mortgage History
| Date | Status | Borrower | Loan Amount |
|---|---|---|---|
| Previous Owner | Tu Tam | $360,000 | |
| Previous Owner | Tu Tam | $412,000 |
Source: Public Records
Tax History Compared to Growth
Tax History
| Year | Tax Paid | Tax Assessment Tax Assessment Total Assessment is a certain percentage of the fair market value that is determined by local assessors to be the total taxable value of land and additions on the property. | Land | Improvement |
|---|---|---|---|---|
| 2025 | $8,491 | $732,218 | $634,623 | $97,595 |
| 2024 | $8,491 | $717,861 | $622,179 | $95,682 |
| 2023 | $8,222 | $703,786 | $609,980 | $93,806 |
| 2022 | $8,048 | $689,987 | $598,020 | $91,967 |
| 2021 | $7,756 | $676,458 | $586,294 | $90,164 |
| 2020 | $7,667 | $669,522 | $580,282 | $89,240 |
| 2019 | $7,503 | $656,395 | $568,904 | $87,491 |
| 2018 | $7,352 | $643,525 | $557,749 | $85,776 |
| 2017 | $7,227 | $630,907 | $546,812 | $84,095 |
| 2016 | $7,071 | $618,537 | $536,090 | $82,447 |
| 2015 | $6,808 | $590,782 | $517,693 | $73,089 |
| 2014 | $6,774 | $590,782 | $517,693 | $73,089 |
Source: Public Records
Map
Nearby Homes
- 1111 S Coast Dr Unit 18
- 3149 Sharon Ln
- 1081 Tulare Dr
- 1110 Redding Ave
- 1387 Garlingford St
- 3131 Lincoln Way
- 3050 Madison Ave
- 3351 Via Trentino Unit 76
- 1174 Kingston St
- 3375 Fuchsia St
- 3460 San Rafael Cir
- 3485 Venetian Dr
- 2511 W Sunflower Ave Unit P6
- 2511 W Sunflower Ave Unit F11
- 2865 Mendoza Dr
- 3626 S Marine St
- 2619 W Aurora St
- 2732 W Orion Ave
- 2726 W Orion Ave
- 1010 Valencia St