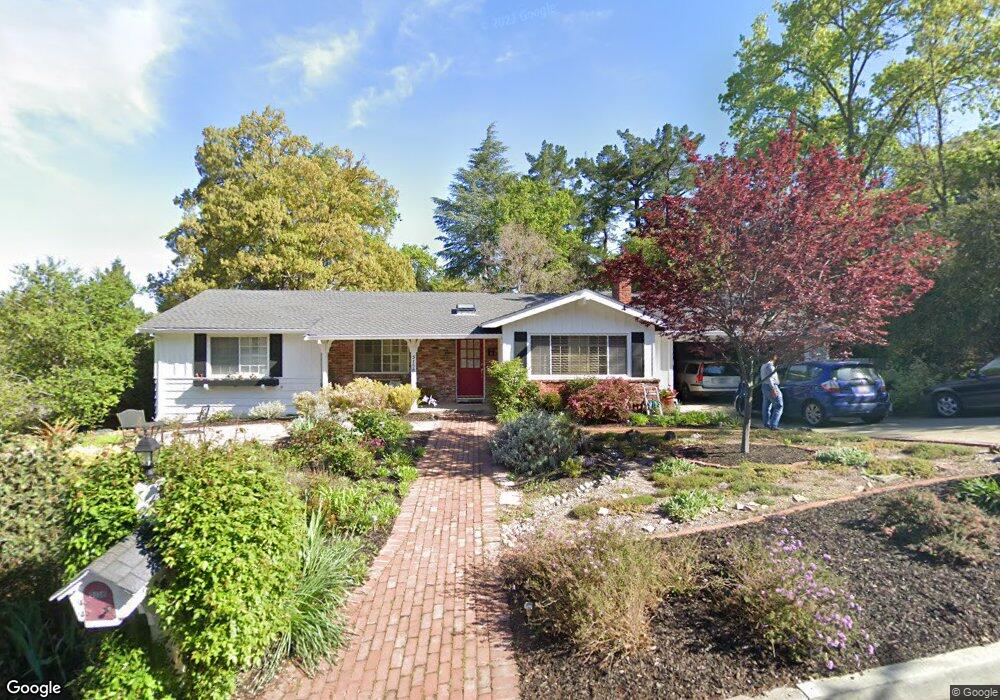
3158 Maryola Ct Lafayette, CA 94549
Peardale Estates NeighborhoodEstimated Value: $1,353,000 - $1,675,000
3
Beds
3
Baths
1,910
Sq Ft
$815/Sq Ft
Est. Value
About This Home
This home is located at 3158 Maryola Ct, Lafayette, CA 94549 and is currently estimated at $1,557,466, approximately $815 per square foot. 3158 Maryola Ct is a home located in Contra Costa County with nearby schools including Burton Valley Elementary School, Stanley Middle School, and Acalanes High School.
Ownership History
Date
Name
Owned For
Owner Type
Purchase Details
Closed on
May 1, 2012
Sold by
Hollshwandner Edward S and Honegger Heather
Bought by
Hollshwandner Edward S and Honegger Heather
Current Estimated Value
Purchase Details
Closed on
Apr 25, 1997
Sold by
Robins Richard and Robins Kristina W
Bought by
Hollshwandner Edward S and Honegger Heather
Home Financials for this Owner
Home Financials are based on the most recent Mortgage that was taken out on this home.
Original Mortgage
$300,000
Outstanding Balance
$39,744
Interest Rate
7.62%
Mortgage Type
Purchase Money Mortgage
Estimated Equity
$1,517,722
Purchase Details
Closed on
May 28, 1996
Sold by
Lundmark Alan H and Lundmark Gwendolyn R
Bought by
Robins Richard and Robins Kristina W
Home Financials for this Owner
Home Financials are based on the most recent Mortgage that was taken out on this home.
Original Mortgage
$284,000
Interest Rate
8.25%
Mortgage Type
Purchase Money Mortgage
Purchase Details
Closed on
Apr 15, 1996
Sold by
Lundmark Alan H and Lundmark Gwendolyn R
Bought by
Lundmark Alan H and Lundmark Gwendolyn R
Home Financials for this Owner
Home Financials are based on the most recent Mortgage that was taken out on this home.
Original Mortgage
$284,000
Interest Rate
8.25%
Mortgage Type
Purchase Money Mortgage
Create a Home Valuation Report for This Property
The Home Valuation Report is an in-depth analysis detailing your home's value as well as a comparison with similar homes in the area
Home Values in the Area
Average Home Value in this Area
Purchase History
| Date | Buyer | Sale Price | Title Company |
|---|---|---|---|
| Hollshwandner Edward S | -- | None Available | |
| Hollshwandner Edward S | $429,000 | Placer Title Company | |
| Robins Richard | $355,000 | Placer Title Company | |
| Lundmark Alan H | -- | -- |
Source: Public Records
Mortgage History
| Date | Status | Borrower | Loan Amount |
|---|---|---|---|
| Open | Hollshwandner Edward S | $300,000 | |
| Previous Owner | Robins Richard | $284,000 |
Source: Public Records
Tax History Compared to Growth
Tax History
| Year | Tax Paid | Tax Assessment Tax Assessment Total Assessment is a certain percentage of the fair market value that is determined by local assessors to be the total taxable value of land and additions on the property. | Land | Improvement |
|---|---|---|---|---|
| 2025 | $8,173 | $698,685 | $319,211 | $379,474 |
| 2024 | $8,024 | $684,986 | $312,952 | $372,034 |
| 2023 | $8,024 | $671,556 | $306,816 | $364,740 |
| 2022 | $7,907 | $658,389 | $300,800 | $357,589 |
| 2021 | $7,668 | $645,480 | $294,902 | $350,578 |
| 2019 | $8,500 | $626,337 | $286,156 | $340,181 |
| 2018 | $8,203 | $614,057 | $280,546 | $333,511 |
| 2017 | $8,063 | $602,018 | $275,046 | $326,972 |
| 2016 | $7,895 | $590,214 | $269,653 | $320,561 |
| 2015 | $7,676 | $581,349 | $265,603 | $315,746 |
| 2014 | $7,590 | $569,962 | $260,401 | $309,561 |
Source: Public Records
Map
Nearby Homes
- 20 Woodbury Highlands Ct Unit 10
- 3101 Old Tunnel Rd
- 3075 Camino Diablo
- 0 Gladys Ct
- 3279 Mt Diablo Ct Unit 13
- 3279 Mt Diablo Ct Unit 4
- 922 Brown Ave
- 315 Saranap Ave
- 21 Samantha Dr
- 9 Westminster Place
- 1160 Dunsyre Dr
- 194 Hillcroft Way
- 1220 Kendall Ct
- 940 Reliez Station Ln
- 130 Hillcroft Way
- 3523 Freeman Rd
- 105 Hillcroft Way
- 40 Rodrigues Ln
- 959 Janet Ln
- 1600 Springbrook Rd
- 3152 Maryola Ct
- 3164 Maryola Ct
- 3161 Old Tunnel Rd
- 3167 Old Tunnel Rd
- 3159 Maryola Ct
- 3165 Maryola Ct
- 3153 Maryola Ct
- 3146 Maryola Ct
- 3148 Maryola Ct
- 3147 Maryola Ct
- 1039 Windsor Dr
- 3156 Mars Ct
- 3169 Old Tunnel Rd
- 3150 Mars Ct
- 1037 Windsor Dr
- 3141 Maryola Ct
- 3146 Old Tunnel Rd
- 3156 Old Tunnel Rd
- 3144 Old Tunnel Rd
- 3140 Maryola Ct