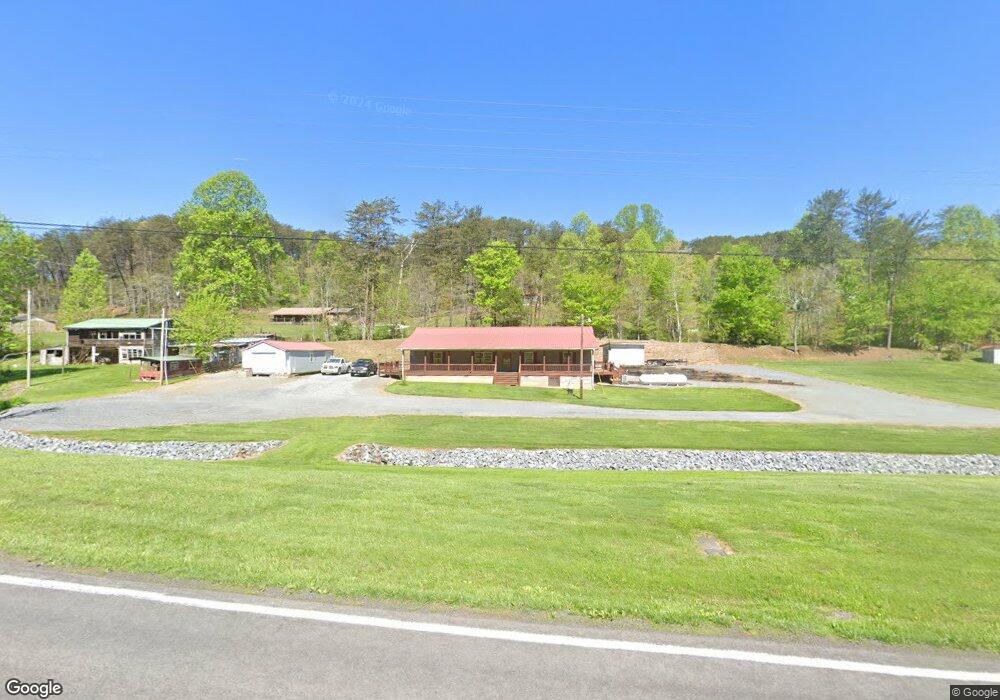
3159 Highway 68 Turtletown, TN 37391
Estimated Value: $160,391 - $226,000
--
Bed
--
Bath
1,536
Sq Ft
$126/Sq Ft
Est. Value
About This Home
This home is located at 3159 Highway 68, Turtletown, TN 37391 and is currently estimated at $194,098, approximately $126 per square foot. 3159 Highway 68 is a home.
Ownership History
Date
Name
Owned For
Owner Type
Purchase Details
Closed on
Mar 16, 2022
Sold by
Mealer Darris Wayn E and Mealer Gail Wanda
Bought by
Mealer Darris Wayne
Current Estimated Value
Purchase Details
Closed on
Sep 28, 2016
Sold by
Coleman Leona Mae Estate
Bought by
Mealer Darris Wayne and Mealer Wanda Gail
Purchase Details
Closed on
Mar 26, 2002
Bought by
Mealer Daris Wayne
Purchase Details
Closed on
Oct 26, 1992
Bought by
Mealer Kenneth Daris
Purchase Details
Closed on
Aug 17, 1982
Bought by
Mealer Kenneth D and Mealer Mary E
Purchase Details
Closed on
Jun 25, 1977
Purchase Details
Closed on
Jan 3, 1974
Create a Home Valuation Report for This Property
The Home Valuation Report is an in-depth analysis detailing your home's value as well as a comparison with similar homes in the area
Home Values in the Area
Average Home Value in this Area
Purchase History
| Date | Buyer | Sale Price | Title Company |
|---|---|---|---|
| Mealer Darris Wayne | -- | None Listed On Document | |
| Mealer Darris Wayne | -- | -- | |
| Mealer Daris Wayne | $1,000 | -- | |
| Mealer Kenneth Daris | -- | -- | |
| Mealer Kenneth D | -- | -- | |
| -- | -- | -- | |
| -- | -- | -- |
Source: Public Records
Tax History Compared to Growth
Tax History
| Year | Tax Paid | Tax Assessment Tax Assessment Total Assessment is a certain percentage of the fair market value that is determined by local assessors to be the total taxable value of land and additions on the property. | Land | Improvement |
|---|---|---|---|---|
| 2024 | $571 | $33,800 | $3,625 | $30,175 |
| 2023 | $571 | $33,800 | $0 | $0 |
| 2022 | $555 | $22,075 | $2,750 | $19,325 |
| 2021 | $555 | $22,075 | $2,750 | $19,325 |
| 2020 | $555 | $22,075 | $2,750 | $19,325 |
| 2019 | $555 | $22,075 | $2,750 | $19,325 |
| 2018 | $555 | $22,075 | $2,750 | $19,325 |
| 2017 | $550 | $21,825 | $2,750 | $19,075 |
| 2016 | $540 | $21,825 | $2,750 | $19,075 |
| 2015 | $540 | $22,500 | $3,450 | $19,050 |
| 2014 | $541 | $22,512 | $0 | $0 |
Source: Public Records
Map
Nearby Homes
- 114 Blackhawk Ln
- 00 Stiles Rd
- 130 Golden Eagle Cir
- 115 Blackhawk
- 198 Laurel Dr
- 00 Laurel Dr
- 16 Ac Campbell Cove Creek Rd
- 240 McJunkin Rd
- 119 Cantrell Ln
- 123 Ridgeline Dr
- 335 Taylor Rd
- 3892 Highway 68
- 2352 Tennessee 68
- 283 Golden Eagle Cir
- 313 Golden Eagle Cir
- 0 Blalock Dr Unit 412700
- 299 Sassafras Ridge Rd
- 168 Singo Dr
- 1051 Ducks Nest Rd
- 140 Croft Chapel Rd
- 3157 Highway 68
- 3164 Tennessee 68
- 3164 Highway 68
- 3144 Highway 68
- 131 Abercrombie Ln
- 131 Abercrombie Ln
- 161 Abercrombie Ln
- 165 Abercrombie Ln
- 171 Abercrombie Ln
- 3179 Highway 68
- 135 Stiles Rd
- 3203 Highway 68
- 3180 Highway 68
- 146 Stiles Rd
- 182 Abercrombie Ln
- 35.41 Ac Stiles Rd
- 43.81 Stiles Rd
- 3262 Highway 68
- 3243 Highway 68
- Lot Golden Eagle Cir