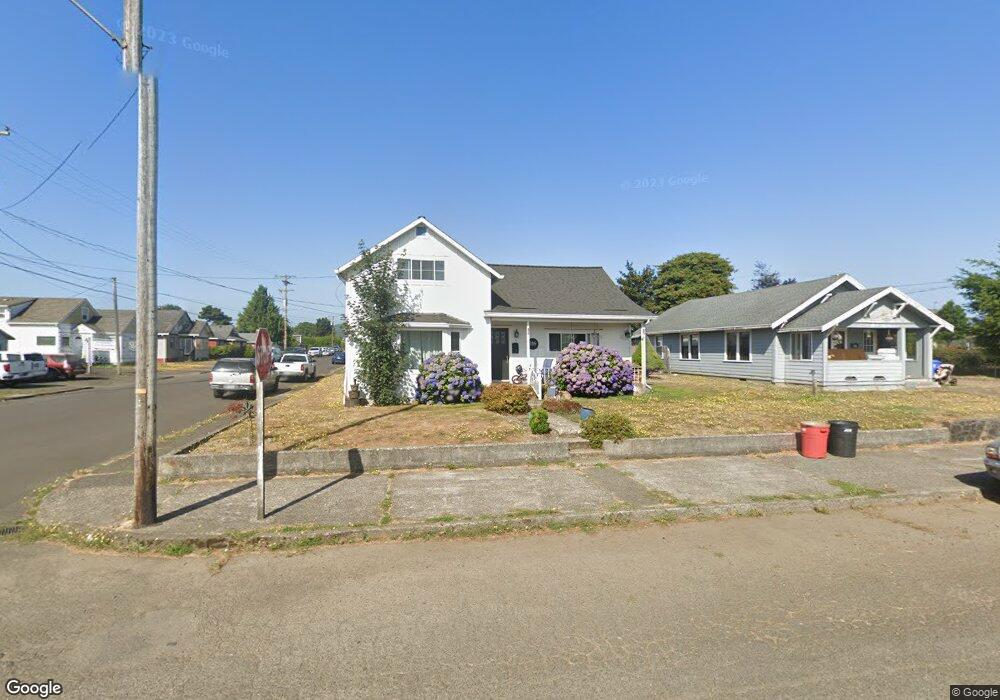
316 Birch Ave Tillamook, OR 97141
Estimated Value: $344,000 - $390,000
3
Beds
3
Baths
1,833
Sq Ft
$199/Sq Ft
Est. Value
About This Home
This home is located at 316 Birch Ave, Tillamook, OR 97141 and is currently estimated at $364,281, approximately $198 per square foot. 316 Birch Ave is a home located in Tillamook County with nearby schools including Tillamook High School, Tillamook Adventist School, and Pacific Christian School.
Ownership History
Date
Name
Owned For
Owner Type
Purchase Details
Closed on
Jun 22, 2015
Sold by
Galusha Leah M and Galusha Clint A
Bought by
Noffsinger Garrett and Noffsinger Tabatha
Current Estimated Value
Home Financials for this Owner
Home Financials are based on the most recent Mortgage that was taken out on this home.
Original Mortgage
$178,571
Outstanding Balance
$137,421
Interest Rate
3.81%
Mortgage Type
New Conventional
Estimated Equity
$226,860
Purchase Details
Closed on
Jun 28, 2011
Sold by
Borrayo Jose and Rocha Jose Borrayo
Bought by
Galusha Leah M and Galusha Clint A
Home Financials for this Owner
Home Financials are based on the most recent Mortgage that was taken out on this home.
Original Mortgage
$146,632
Interest Rate
4.55%
Mortgage Type
New Conventional
Create a Home Valuation Report for This Property
The Home Valuation Report is an in-depth analysis detailing your home's value as well as a comparison with similar homes in the area
Home Values in the Area
Average Home Value in this Area
Purchase History
| Date | Buyer | Sale Price | Title Company |
|---|---|---|---|
| Noffsinger Garrett | $175,500 | First American | |
| Galusha Leah M | $141,500 | First American |
Source: Public Records
Mortgage History
| Date | Status | Borrower | Loan Amount |
|---|---|---|---|
| Open | Noffsinger Garrett | $178,571 | |
| Previous Owner | Galusha Leah M | $146,632 |
Source: Public Records
Tax History
| Year | Tax Paid | Tax Assessment Tax Assessment Total Assessment is a certain percentage of the fair market value that is determined by local assessors to be the total taxable value of land and additions on the property. | Land | Improvement |
|---|---|---|---|---|
| 2025 | $1,697 | $140,740 | $50,850 | $89,890 |
| 2024 | $1,613 | $136,650 | $49,370 | $87,280 |
| 2023 | $1,598 | $132,670 | $47,930 | $84,740 |
| 2022 | $1,543 | $128,810 | $46,530 | $82,280 |
| 2021 | $1,498 | $125,060 | $45,170 | $79,890 |
| 2020 | $1,457 | $121,420 | $43,850 | $77,570 |
| 2019 | $1,420 | $117,890 | $42,570 | $75,320 |
| 2018 | $1,383 | $114,460 | $41,330 | $73,130 |
| 2017 | $1,348 | $111,130 | $40,130 | $71,000 |
| 2016 | $1,298 | $107,900 | $38,960 | $68,940 |
| 2015 | $1,272 | $104,760 | $37,830 | $66,930 |
| 2014 | -- | $101,710 | $36,730 | $64,980 |
| 2013 | -- | $98,750 | $35,660 | $63,090 |
Source: Public Records
Map
Nearby Homes
- 116 Cedar Ave
- 1403 5th St
- 1209 6th St
- 605 Cottonwood Ave
- 1708 4th St
- 1706 5th St
- 1806 8th St
- 1003 Grove Ave
- 2205 5th St
- 2105 9th St
- 2305 7th St
- 00201 Wilson River Hwy
- TL# 02100 Wilson River Hwy
- Parcel 1 Wilson River Hwy
- Parcel 2 Wilson River Hwy
- 02600 12th St
- Lot 2405 12th St
- 2418 1st St
- 2506 1st St
- 17805 U S 101 S