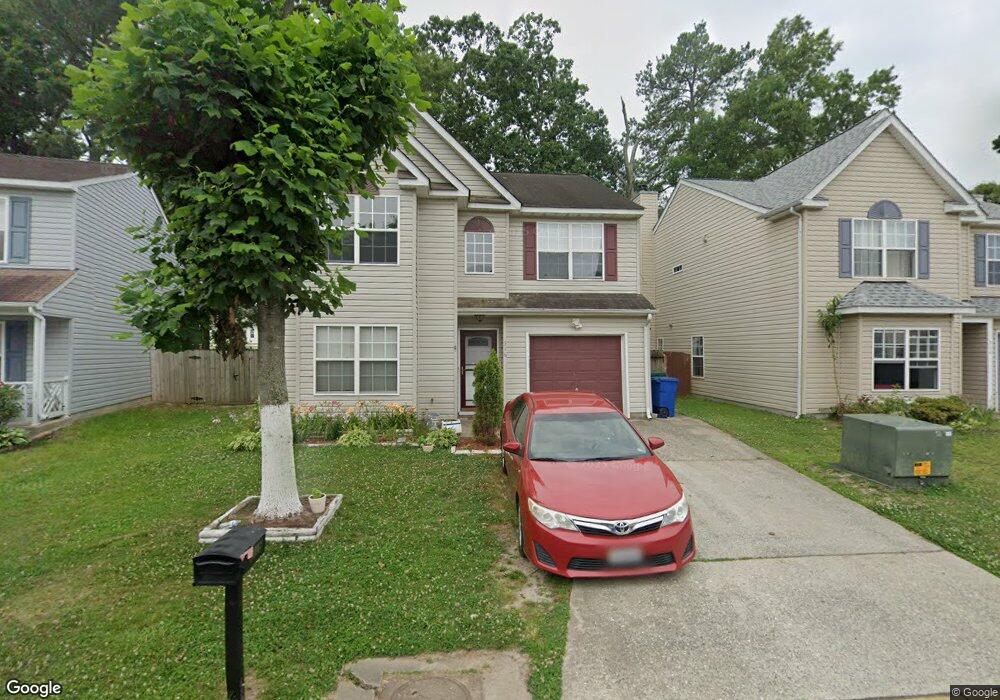
316 Bradmere Loop Newport News, VA 23608
Lee Hall NeighborhoodEstimated Value: $336,000 - $342,000
4
Beds
3
Baths
2,082
Sq Ft
$163/Sq Ft
Est. Value
About This Home
This home is located at 316 Bradmere Loop, Newport News, VA 23608 and is currently estimated at $339,234, approximately $162 per square foot. 316 Bradmere Loop is a home located in Newport News City with nearby schools including Katherine G. Johnson Elementary School, Mary Passage Middle School, and Woodside High School.
Ownership History
Date
Name
Owned For
Owner Type
Purchase Details
Closed on
Jul 25, 2019
Sold by
Burkett Jeffrey J and Burkett Krista J
Bought by
Ibrahim Omar Al Mari Al and Amro Zahra
Current Estimated Value
Home Financials for this Owner
Home Financials are based on the most recent Mortgage that was taken out on this home.
Original Mortgage
$194,970
Outstanding Balance
$170,373
Interest Rate
3.8%
Mortgage Type
New Conventional
Estimated Equity
$168,861
Purchase Details
Closed on
Jul 6, 2011
Sold by
Zhang Guo S
Bought by
Burkett Jeffrey J
Home Financials for this Owner
Home Financials are based on the most recent Mortgage that was taken out on this home.
Original Mortgage
$193,982
Interest Rate
4.58%
Mortgage Type
VA
Purchase Details
Closed on
Jan 5, 2001
Sold by
Jordans Crossing L Lc
Bought by
Grelish David A
Home Financials for this Owner
Home Financials are based on the most recent Mortgage that was taken out on this home.
Original Mortgage
$129,300
Interest Rate
7.14%
Create a Home Valuation Report for This Property
The Home Valuation Report is an in-depth analysis detailing your home's value as well as a comparison with similar homes in the area
Home Values in the Area
Average Home Value in this Area
Purchase History
| Date | Buyer | Sale Price | Title Company |
|---|---|---|---|
| Ibrahim Omar Al Mari Al | $215,000 | Barristers Of Virginia | |
| Burkett Jeffrey J | $189,900 | -- | |
| Grelish David A | $126,800 | -- |
Source: Public Records
Mortgage History
| Date | Status | Borrower | Loan Amount |
|---|---|---|---|
| Open | Ibrahim Omar Al Mari Al | $194,970 | |
| Previous Owner | Burkett Jeffrey J | $193,982 | |
| Previous Owner | Grelish David A | $129,300 |
Source: Public Records
Tax History Compared to Growth
Tax History
| Year | Tax Paid | Tax Assessment Tax Assessment Total Assessment is a certain percentage of the fair market value that is determined by local assessors to be the total taxable value of land and additions on the property. | Land | Improvement |
|---|---|---|---|---|
| 2025 | $3,708 | $313,700 | $63,600 | $250,100 |
| 2024 | $3,561 | $301,800 | $63,600 | $238,200 |
| 2023 | $3,501 | $284,200 | $63,600 | $220,600 |
| 2022 | $3,280 | $261,100 | $63,600 | $197,500 |
| 2021 | $2,918 | $239,200 | $53,000 | $186,200 |
| 2020 | $2,955 | $230,200 | $53,000 | $177,200 |
| 2019 | $2,788 | $218,600 | $53,000 | $165,600 |
| 2018 | $2,748 | $213,800 | $53,000 | $160,800 |
| 2017 | $2,637 | $204,700 | $53,000 | $151,700 |
| 2016 | $2,449 | $189,700 | $53,000 | $136,700 |
| 2015 | $2,443 | $189,700 | $53,000 | $136,700 |
| 2014 | $2,186 | $189,700 | $53,000 | $136,700 |
Source: Public Records
Map
Nearby Homes
- 621 McLaw Dr
- 192 S Hunt Club Run
- 217 Rivers Ridge Cir
- 206 Quarter Trail Unit F
- 204 Quarter Trail Unit C
- 325 Lees Mill Dr
- 214 Quarter Trail
- 211 Old Bridge Ct
- 364 Rivers Ridge Cir
- 481 Lees Mill Dr
- 478 Rivers Ridge Cir
- 114 Ashton Green Blvd
- 108 W Rexford Dr
- 112 W Rexford Dr
- 431 Old Colonial Way Unit 203
- 91 W Rexford Dr
- 17247 Warwick Blvd
- 306 Wythe St
- 4 Prince George Ln
- 3 Grant Dr
- 314 Bradmere Loop
- 318 Bradmere Loop
- 312 Bradmere Loop
- 320 Bradmere Loop
- 317 Bradmere Loop
- 310 Bradmere Loop
- 323 Bradmere Loop
- 322 Bradmere Loop
- 308 Bradmere Loop
- 327 Bradmere Loop
- 324 Bradmere Loop
- 101 Gretna Way
- 104 Gretna Way
- 306 Bradmere Loop
- 326 Bradmere Loop
- 103 Gretna Way
- 103 Gretna Way Unit 1
- 205 Bradmere Loop
- 203 Bradmere Loop
- 304 Bradmere Loop