Estimated Value: $498,288 - $551,000
--
Bed
3
Baths
2,048
Sq Ft
$254/Sq Ft
Est. Value
About This Home
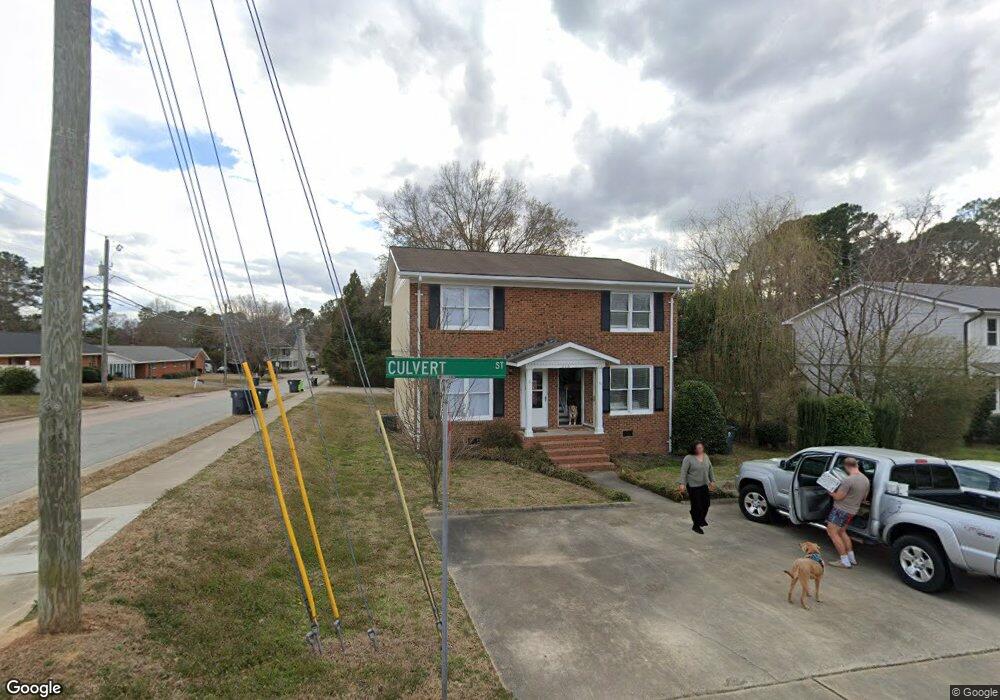
This home is located at 316 Culvert St, Apex, NC 27502 and is currently estimated at $519,429, approximately $253 per square foot. 316 Culvert St is a home located in Wake County with nearby schools including Apex Elementary School, Apex Middle, and Apex High School.
Ownership History
Date
Name
Owned For
Owner Type
Purchase Details
Closed on
May 1, 2017
Sold by
Hammer Susan Edens
Bought by
Bld Properties Llc
Current Estimated Value
Purchase Details
Closed on
Jul 3, 2012
Sold by
Hammer Douglas Ira and Hammer Susan Edens
Bought by
Hammer Susan Edens
Purchase Details
Closed on
May 27, 2004
Sold by
Faircloth Associates Llc
Bought by
Green Robert A and Green Marian M
Home Financials for this Owner
Home Financials are based on the most recent Mortgage that was taken out on this home.
Original Mortgage
$120,000
Interest Rate
5.88%
Mortgage Type
Purchase Money Mortgage
Purchase Details
Closed on
Jan 1, 1975
Bought by
Hammer, Susan Edens Trustee
Create a Home Valuation Report for This Property
The Home Valuation Report is an in-depth analysis detailing your home's value as well as a comparison with similar homes in the area
Home Values in the Area
Average Home Value in this Area
Purchase History
| Date | Buyer | Sale Price | Title Company |
|---|---|---|---|
| Bld Properties Llc | $170,000 | None Available | |
| Hammer Susan Edens | -- | None Available | |
| Green Robert A | $150,000 | None Available | |
| Faircloth Associates Llc | $140,000 | None Available | |
| Hammer, Susan Edens Trustee | $96,000 | -- |
Source: Public Records
Mortgage History
| Date | Status | Borrower | Loan Amount |
|---|---|---|---|
| Previous Owner | Faircloth Associates Llc | $120,000 |
Source: Public Records
Tax History Compared to Growth
Tax History
| Year | Tax Paid | Tax Assessment Tax Assessment Total Assessment is a certain percentage of the fair market value that is determined by local assessors to be the total taxable value of land and additions on the property. | Land | Improvement |
|---|---|---|---|---|
| 2025 | $3,924 | $444,858 | $230,000 | $214,858 |
| 2024 | $3,849 | $446,303 | $230,000 | $216,303 |
| 2023 | $2,534 | $227,373 | $90,000 | $137,373 |
| 2022 | $2,381 | $227,373 | $90,000 | $137,373 |
| 2021 | $2,291 | $227,373 | $90,000 | $137,373 |
| 2020 | $2,268 | $227,373 | $90,000 | $137,373 |
| 2019 | $2,028 | $175,006 | $72,000 | $103,006 |
| 2018 | $1,912 | $175,006 | $72,000 | $103,006 |
| 2017 | $1,781 | $175,006 | $72,000 | $103,006 |
| 2016 | $1,756 | $197,722 | $80,000 | $117,722 |
| 2015 | $1,735 | $168,695 | $52,000 | $116,695 |
| 2014 | -- | $168,695 | $52,000 | $116,695 |
Source: Public Records
Map
Nearby Homes
- 311 Culvert St
- 309 Culvert St
- 105 Cunningham St
- 307 S Elm St
- 202 W Chatham St
- 635 Sawcut Ln
- 631 Sawcut Ln
- 633 Sawcut Ln
- 314 Wrenn St
- 547 Grand Central Station
- 406 S Salem St
- 596 Grand Central Station
- 506 W Chatham St
- 410 2nd St
- 1000 Oakgate Ct
- 295 Williams Grove Ln Unit Lot 67
- 285 Williams Grove Ln Unit Lot 65
- 281 Williams Grove Ln Unit Lot 64
- 281 Williams Grove Ln
- 903 Norwood Ln
- 114 N Mason St
- 312 Culvert St
- 201 N Mason St
- 401 Culvert St
- 319 E Chatham St
- 310 Culvert St Unit B
- 310 Culvert St
- 200 N Mason St
- 313 Culvert St
- 404 Culvert St
- 203 N Mason St
- 317 E Chatham St
- 403 E Chatham St
- 204 N Mason St
- 315 E Chatham St
- 308 Culvert St
- 408 Culvert St
- 209 N Mason St
- 409 Culvert St
- 307 E Chatham St