Estimated Value: $162,000 - $239,000
2
Beds
1
Bath
720
Sq Ft
$265/Sq Ft
Est. Value
About This Home
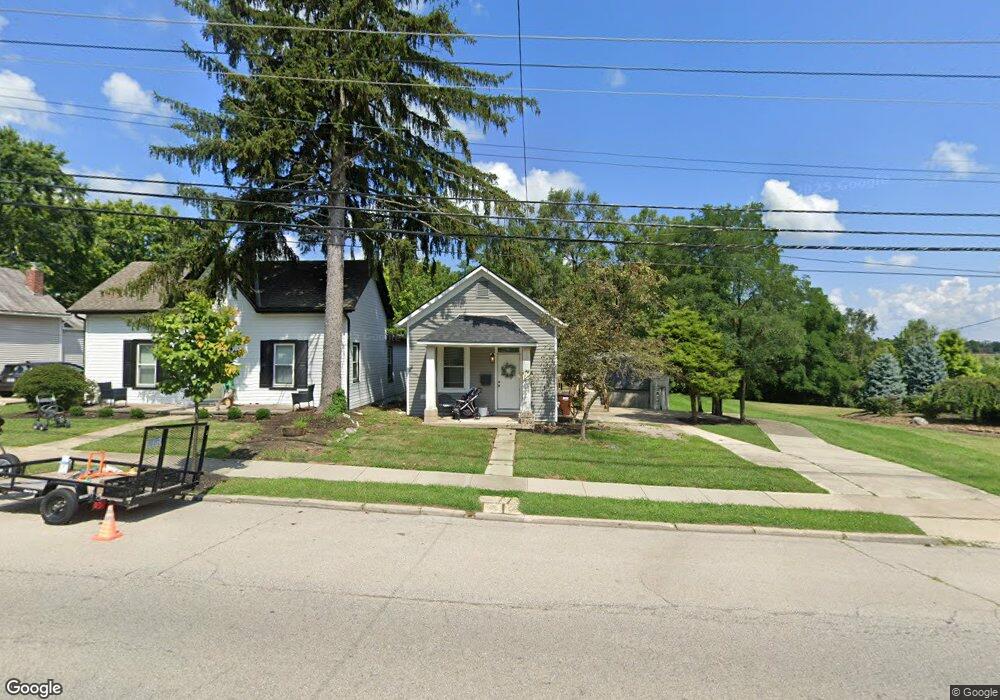
This home is located at 316 E Main St Unit A, Mason, OH 45040 and is currently estimated at $190,493, approximately $264 per square foot. 316 E Main St Unit A is a home located in Warren County with nearby schools including Mason Intermediate Elementary School, Mason Middle School, and William Mason High School.
Ownership History
Date
Name
Owned For
Owner Type
Purchase Details
Closed on
Jul 13, 2020
Sold by
Winchester Nickala K
Bought by
610 Development Llc
Current Estimated Value
Purchase Details
Closed on
Aug 15, 2019
Sold by
Nelson Jamie D and Graham Jodie A
Bought by
Winchester Nickala K
Purchase Details
Closed on
Aug 12, 2019
Sold by
Winchester Nancy
Bought by
Winchester Nickala K
Purchase Details
Closed on
Jul 30, 2019
Sold by
Estate Of James Winchester
Bought by
Nelson Jamie D and Graham Jodie A
Purchase Details
Closed on
Oct 25, 2004
Sold by
Winchester James A and Winchester Nancy
Bought by
Winchester James A and Winchester Nancy
Purchase Details
Closed on
Jun 17, 1994
Sold by
Helton Jasper
Bought by
Nancy James A and Nancy Winchester
Purchase Details
Closed on
May 19, 1986
Sold by
Eberhard Eberhard and Eberhard Donald M
Bought by
Helton Helton and Helton Jasper
Purchase Details
Closed on
Jul 20, 1978
Sold by
Mullins Mullins and Mullins Clarence L
Create a Home Valuation Report for This Property
The Home Valuation Report is an in-depth analysis detailing your home's value as well as a comparison with similar homes in the area
Home Values in the Area
Average Home Value in this Area
Purchase History
| Date | Buyer | Sale Price | Title Company |
|---|---|---|---|
| 610 Development Llc | $93,000 | None Available | |
| Winchester Nickala K | -- | None Available | |
| Winchester Nickala K | -- | None Available | |
| Nelson Jamie D | -- | None Available | |
| Winchester James A | -- | -- | |
| Nancy James A | $37,000 | -- | |
| Helton Helton | $29,000 | -- | |
| -- | -- | -- |
Source: Public Records
Tax History
| Year | Tax Paid | Tax Assessment Tax Assessment Total Assessment is a certain percentage of the fair market value that is determined by local assessors to be the total taxable value of land and additions on the property. | Land | Improvement |
|---|---|---|---|---|
| 2025 | $2,125 | $51,140 | $29,490 | $21,650 |
| 2024 | $2,125 | $51,140 | $29,490 | $21,650 |
| 2023 | $1,661 | $33,778 | $14,507 | $19,271 |
| 2022 | $1,639 | $33,779 | $14,508 | $19,271 |
| 2021 | $1,552 | $33,779 | $14,508 | $19,271 |
| 2020 | $1,477 | $27,461 | $11,795 | $15,666 |
| 2019 | $902 | $27,461 | $11,795 | $15,666 |
| 2018 | $905 | $27,461 | $11,795 | $15,666 |
| 2017 | $922 | $26,569 | $11,540 | $15,029 |
| 2016 | $950 | $26,569 | $11,540 | $15,029 |
| 2015 | $952 | $26,569 | $11,540 | $15,029 |
| 2014 | $955 | $25,410 | $11,200 | $14,210 |
| 2013 | $957 | $26,760 | $11,800 | $14,960 |
Source: Public Records
Map
Nearby Homes
- 308 E Main St
- 306 E Main St
- 304 E Main St
- 107 Cowan Dr
- 5130 Franklin Park St
- 5173 Franklin Park St
- 4922 Bordeaux Ln Unit 4922
- 200 Woodland Rd
- 404 W Church St
- 4897 Bordeaux Ln Unit 4897
- 4268 Fontenay
- 4943 Isaac Ln
- 4782 Bordeaux Ln
- 4776 Bordeaux Ln
- 4684 Court Yard Dr
- 4734 Margaret Ct
- 4492 Angeline
- 600 W Church St
- 3 Carnell Place
- 4163 Spyglass Hill Unit 4163
- 316 E Main St
- 314 E Main St Unit A
- 312 E Main St
- 312 E Main St Unit A
- 310 E Main St
- 310 E Main St Unit A
- 308 E Main St Unit A
- 306 E Main St Unit A
- 311 E Main St
- 405 E Main St
- 313 E Main St
- 304 E Main St Unit A
- 315 E Main St
- 307 E Main St
- 9134 U S 42
- 317 E Main St
- 302 E Main St
- 208 E North St
- 319 E Main St
- 305 E Main St
Your Personal Tour Guide
Ask me questions while you tour the home.