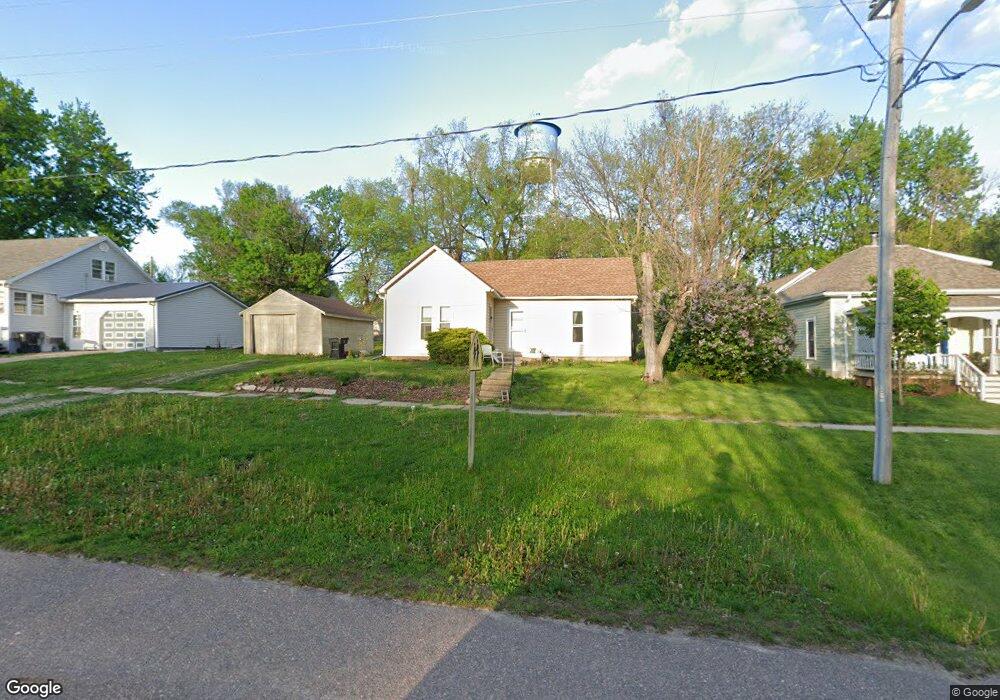
316 Elm St Pierson, IA 51048
Estimated Value: $64,670 - $116,000
1
Bed
1
Bath
520
Sq Ft
$152/Sq Ft
Est. Value
About This Home
This home is located at 316 Elm St, Pierson, IA 51048 and is currently estimated at $79,168, approximately $152 per square foot. 316 Elm St is a home located in Woodbury County with nearby schools including Pierson Elementary School, Pierson Middle School, and Kingsley-Pierson High School.
Ownership History
Date
Name
Owned For
Owner Type
Purchase Details
Closed on
Aug 2, 2021
Sold by
Newubaum Dougla M
Bought by
Hansen Michelle L
Current Estimated Value
Purchase Details
Closed on
Jan 21, 2005
Sold by
Schneider Loren and Schneider Jane
Bought by
Neubaum Douglas M
Home Financials for this Owner
Home Financials are based on the most recent Mortgage that was taken out on this home.
Original Mortgage
$27,075
Interest Rate
5.83%
Mortgage Type
New Conventional
Create a Home Valuation Report for This Property
The Home Valuation Report is an in-depth analysis detailing your home's value as well as a comparison with similar homes in the area
Home Values in the Area
Average Home Value in this Area
Purchase History
| Date | Buyer | Sale Price | Title Company |
|---|---|---|---|
| Hansen Michelle L | $19,000 | None Available | |
| Neubaum Douglas M | $28,500 | None Available |
Source: Public Records
Mortgage History
| Date | Status | Borrower | Loan Amount |
|---|---|---|---|
| Previous Owner | Neubaum Douglas M | $27,075 |
Source: Public Records
Tax History Compared to Growth
Tax History
| Year | Tax Paid | Tax Assessment Tax Assessment Total Assessment is a certain percentage of the fair market value that is determined by local assessors to be the total taxable value of land and additions on the property. | Land | Improvement |
|---|---|---|---|---|
| 2025 | $884 | $44,620 | $4,210 | $40,410 |
| 2024 | $884 | $49,490 | $4,210 | $45,280 |
| 2023 | $788 | $49,490 | $4,210 | $45,280 |
| 2022 | $776 | $37,300 | $4,210 | $33,090 |
| 2021 | $776 | $37,300 | $4,210 | $33,090 |
| 2020 | $644 | $30,830 | $4,510 | $26,320 |
| 2019 | $624 | $30,080 | $4,510 | $25,570 |
| 2018 | $1,059 | $28,250 | $4,510 | $23,740 |
| 2017 | $642 | $28,250 | $4,510 | $23,740 |
| 2016 | $650 | $28,250 | $0 | $0 |
| 2015 | $614 | $26,400 | $4,210 | $22,190 |
| 2014 | $601 | $26,400 | $4,210 | $22,190 |
Source: Public Records
Map
Nearby Homes