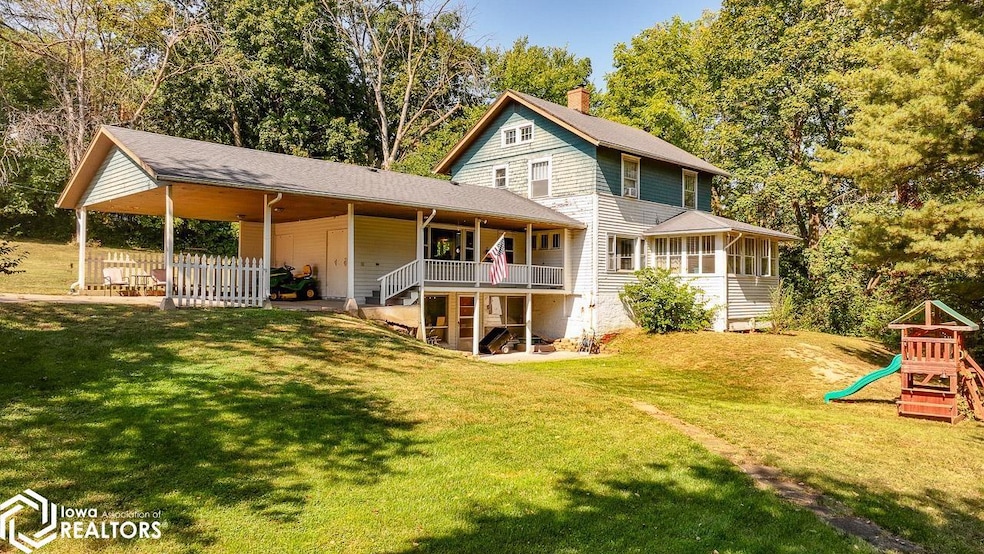
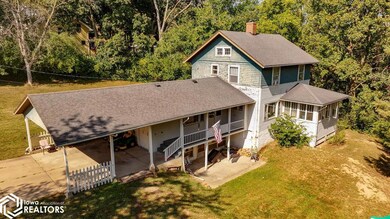
316 Filmore St Ottumwa, IA 52501
Estimated payment $908/month
About This Home
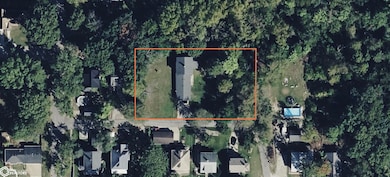
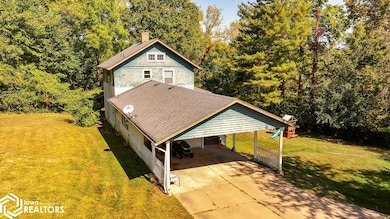
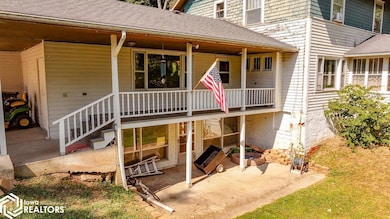
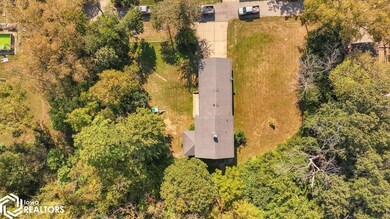
Nestled on four lots, this property offers over an acre of land a rare find in town providing both space and privacy. Inside, you’ll discover more than 1,800 sq. ft. of living space, including a spacious kitchen, a large bonus room perfect for entertaining guests, a bright four-season room, and generously sized bedrooms. Large homes on expansive in town lots are hard to come by, especially at this price! Don’t miss your chance schedule your private showing today! KEY FEATURES Rare in-town space and privacy 1,800+ sq. ft. of living space Spacious kitchen and bonus room Bright four-season room, large bedrooms
Home Details
Home Type
- Single Family
Est. Annual Taxes
- $2,664
Year Built
- Built in 1920
Utilities
- Forced Air Heating System
Additional Features
- Unfinished Basement
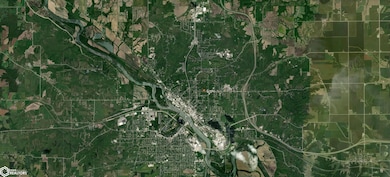
Map
Home Values in the Area
Average Home Value in this Area
Tax History
| Year | Tax Paid | Tax Assessment Tax Assessment Total Assessment is a certain percentage of the fair market value that is determined by local assessors to be the total taxable value of land and additions on the property. | Land | Improvement |
|---|---|---|---|---|
| 2025 | $2,664 | $131,220 | $9,410 | $121,810 |
| 2024 | $2,664 | $122,870 | $9,410 | $113,460 |
| 2023 | $2,354 | $122,870 | $9,410 | $113,460 |
| 2022 | $2,402 | $98,500 | $9,410 | $89,090 |
| 2021 | $2,403 | $94,630 | $9,410 | $85,220 |
| 2020 | $2,244 | $87,290 | $9,410 | $77,880 |
| 2019 | $2,068 | $87,290 | $0 | $0 |
| 2018 | $2,002 | $87,290 | $0 | $0 |
| 2017 | $2,048 | $87,290 | $0 | $0 |
| 2016 | $2,060 | $91,105 | $0 | $0 |
| 2015 | $2,062 | $91,105 | $0 | $0 |
| 2014 | $2,034 | $91,105 | $0 | $0 |
Property History
| Date | Event | Price | List to Sale | Price per Sq Ft | Prior Sale |
|---|---|---|---|---|---|
| 10/09/2025 10/09/25 | For Sale | $129,999 | +57.6% | $72 / Sq Ft | |
| 05/06/2019 05/06/19 | Sold | $82,500 | -13.2% | $45 / Sq Ft | View Prior Sale |
| 04/17/2019 04/17/19 | Pending | -- | -- | -- | |
| 12/01/2018 12/01/18 | For Sale | $95,000 | -- | $52 / Sq Ft |
Source: NoCoast MLS
MLS Number: NOC6332668
APN: 007410510004000
Disclaimer: Certain information contained herein is derived from information provided by parties other than Homes.com. All information provided is deemed reliable, but is not guaranteed to be accurate and should be independently verified.
![]() IDX information is provided exclusively for personal, non-commercial use, and may not be used for any purpose other than to identify prospective properties consumers may be interested in purchasing.
IDX information is provided exclusively for personal, non-commercial use, and may not be used for any purpose other than to identify prospective properties consumers may be interested in purchasing.
Information is deemed reliable but not guaranteed.
- 1405 N Jefferson St Unit 7
- 325 E Maple Ave
- 125 Pennsylvania Ave
- 750 N Green St
- 109 E Woodland Ave
- 749 N Green St
- 905 N Court St
- 1335 N Elm St Unit 208
- 210 W Woodland Ave
- 1119 N Court St
- 209 W Maple Ave
- 132 Lincoln Ave
- 616 Lamborn St
- 306 Oakwood Ave
- 524 N Wapello St
- 1119 N Wapello St
- 427 N Court St
- 1309 Castle St
- 328 N Washington St
- 1404 N Van Buren Ave
