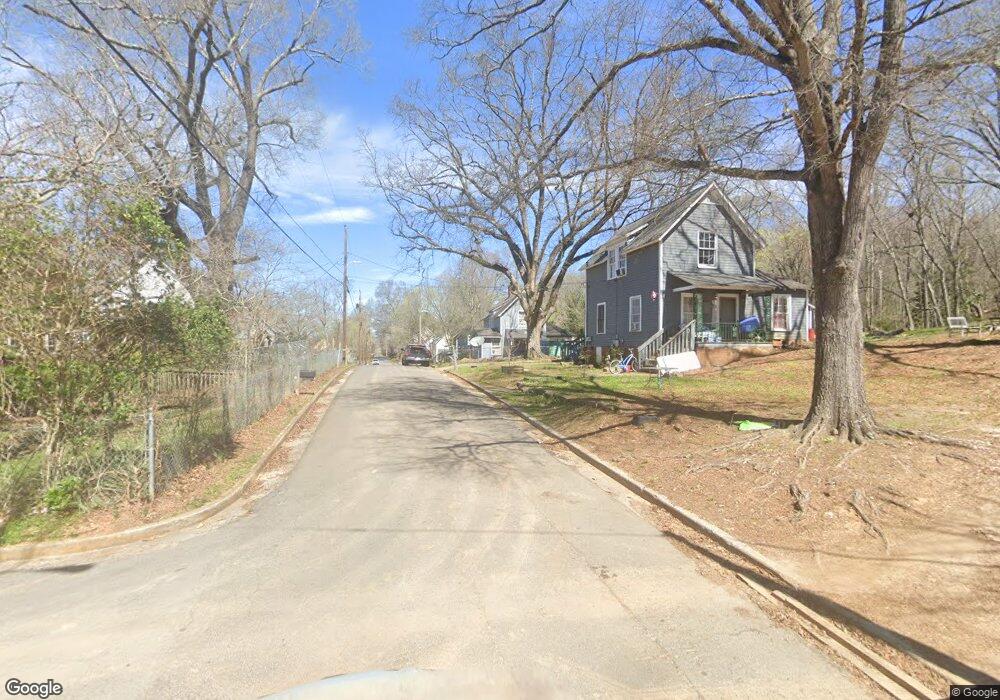
316 Grove Ave SE Lindale, GA 30147
Estimated Value: $107,306 - $193,000
--
Bed
1
Bath
1,454
Sq Ft
$104/Sq Ft
Est. Value
About This Home
This home is located at 316 Grove Ave SE, Lindale, GA 30147 and is currently estimated at $151,327, approximately $104 per square foot. 316 Grove Ave SE is a home located in Floyd County with nearby schools including Pepperell Middle School, Pepperell High School, and Montessori School of Rome.
Ownership History
Date
Name
Owned For
Owner Type
Purchase Details
Closed on
Feb 19, 2016
Sold by
Jackson Doyal L
Bought by
Henegar Belinda
Current Estimated Value
Purchase Details
Closed on
May 17, 1995
Sold by
Jackson Evelyn T
Bought by
Jackson Doyal L and Barbara Evans
Purchase Details
Closed on
Aug 29, 1984
Sold by
Bryan Clarence C and Bryan Jane N
Bought by
Jackson Evelyn T
Purchase Details
Closed on
Nov 10, 1979
Sold by
Rampley Louis
Bought by
Bryan Clarence C and Bryan Jane N
Purchase Details
Closed on
Nov 10, 1978
Bought by
P and R
Purchase Details
Closed on
Sep 28, 1977
Sold by
Rampley Wt and Rampley Louis
Bought by
Rampley Louis
Purchase Details
Closed on
Nov 22, 1972
Sold by
Walters Jessie
Bought by
Rampley Wt and Rampley Louis
Purchase Details
Closed on
Oct 8, 1970
Sold by
Garmon Gerald
Bought by
Walters Jessie
Purchase Details
Closed on
Feb 2, 1965
Sold by
Baker Bobby Lee
Bought by
Garmon Gerald
Purchase Details
Closed on
Jan 1, 1901
Bought by
Baker Bobby Lee
Create a Home Valuation Report for This Property
The Home Valuation Report is an in-depth analysis detailing your home's value as well as a comparison with similar homes in the area
Home Values in the Area
Average Home Value in this Area
Purchase History
| Date | Buyer | Sale Price | Title Company |
|---|---|---|---|
| Henegar Belinda | $5,000 | -- | |
| Jackson Doyal L | -- | -- | |
| Jackson Evelyn T | $17,000 | -- | |
| Bryan Clarence C | -- | -- | |
| P | $9,000 | -- | |
| Rampley Louis | -- | -- | |
| Rampley Wt | $6,300 | -- | |
| Walters Jessie | $6,000 | -- | |
| Garmon Gerald | $4,900 | -- | |
| Baker Bobby Lee | -- | -- |
Source: Public Records
Tax History Compared to Growth
Tax History
| Year | Tax Paid | Tax Assessment Tax Assessment Total Assessment is a certain percentage of the fair market value that is determined by local assessors to be the total taxable value of land and additions on the property. | Land | Improvement |
|---|---|---|---|---|
| 2024 | $727 | $30,270 | $8,224 | $22,046 |
| 2023 | $749 | $31,112 | $7,476 | $23,636 |
| 2022 | $676 | $25,923 | $5,981 | $19,942 |
| 2021 | $543 | $19,009 | $5,981 | $13,028 |
| 2020 | $231 | $5,566 | $4,486 | $1,080 |
| 2019 | $225 | $5,566 | $4,486 | $1,080 |
| 2018 | $223 | $5,566 | $4,486 | $1,080 |
| 2017 | $116 | $5,566 | $4,486 | $1,080 |
| 2016 | $464 | $13,351 | $4,480 | $8,871 |
| 2015 | $456 | $13,351 | $4,480 | $8,871 |
| 2014 | $456 | $13,351 | $4,480 | $8,871 |
Source: Public Records
Map
Nearby Homes
- 305 Grove Ave SE
- 202 Park Ave SE
- 12 Circle Dr SE
- 13 N Terrace Ave SE
- 113 Avenue D SE
- 792 Park Ave SE
- 1572 Booze Mountain Rd SE
- 0 S Edenfield Ridge Dr SE
- 612 Eden Valley Rd SE
- 135 Reeceburg Rd SE
- 302 Jack St
- 169 Jack St SE
- 27 Hughes Dairy Rd SE
- 0 Edenfield Dr SE Unit 21222627
- 280 Ravenwood Dr SE
- 16 Summit Dr SE
- 0 Booze Mountain Rd Unit 10580353
- 4 Club View Dr SE
- 0 Club View Dr SE Unit 22344065
- 33 Summit Dr
- 310 Grove Ave SE
- 315 Grove Ave SE
- 309 Grove Ave SE
- 319 Grove Ave SE
- 306 Grove Ave SE
- 320 Grove Ave SE
- 320 Grove Ave SE
- 401 Grove Ave SE
- 314 Park Ave SE
- 310 Park Ave SE
- 320 Park Ave SE Unit 103
- 320 Park Ave SE
- 304 Grove Ave SE
- 406 Grove Ave SE
- 405/407 SE Grove Ave
- 306 Park Ave SE
- 405 Grove Ave SE
- 404 Park Ave SE Unit 72
- 404 Park Ave SE
- 407 Grove Ave SE