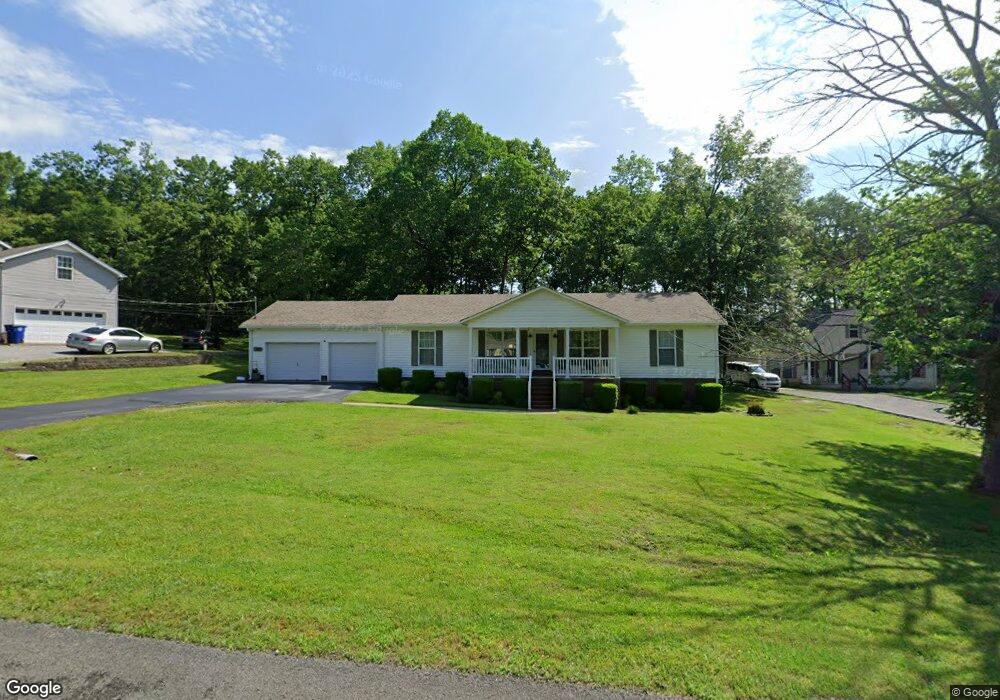
316 Hilltop Dr Shelbyville, TN 37160
Estimated Value: $324,222 - $400,000
--
Bed
3
Baths
2,275
Sq Ft
$157/Sq Ft
Est. Value
About This Home
This home is located at 316 Hilltop Dr, Shelbyville, TN 37160 and is currently estimated at $357,306, approximately $157 per square foot. 316 Hilltop Dr is a home located in Bedford County with nearby schools including South Side Elementary School, Harris Middle School, and Christian Chapel Academy.
Ownership History
Date
Name
Owned For
Owner Type
Purchase Details
Closed on
Aug 13, 1996
Sold by
Isolani Rodney and Isolani Laura
Bought by
Kim James Patrick N and Kim James
Current Estimated Value
Home Financials for this Owner
Home Financials are based on the most recent Mortgage that was taken out on this home.
Original Mortgage
$65,600
Outstanding Balance
$4,811
Interest Rate
8.4%
Estimated Equity
$352,495
Purchase Details
Closed on
Jun 30, 1995
Sold by
Segroves Tom
Bought by
Isolani Rodney and Isolani Laura
Purchase Details
Closed on
Feb 13, 1995
Bought by
Sanders Bobby G
Purchase Details
Closed on
Oct 19, 1963
Bought by
Segroves Tom Trustee
Create a Home Valuation Report for This Property
The Home Valuation Report is an in-depth analysis detailing your home's value as well as a comparison with similar homes in the area
Home Values in the Area
Average Home Value in this Area
Purchase History
| Date | Buyer | Sale Price | Title Company |
|---|---|---|---|
| Kim James Patrick N | $82,000 | -- | |
| Isolani Rodney | $79,500 | -- | |
| Sanders Bobby G | $5,700 | -- | |
| Segroves Tom Trustee | -- | -- |
Source: Public Records
Mortgage History
| Date | Status | Borrower | Loan Amount |
|---|---|---|---|
| Open | Segroves Tom Trustee | $65,600 |
Source: Public Records
Tax History Compared to Growth
Tax History
| Year | Tax Paid | Tax Assessment Tax Assessment Total Assessment is a certain percentage of the fair market value that is determined by local assessors to be the total taxable value of land and additions on the property. | Land | Improvement |
|---|---|---|---|---|
| 2025 | -- | $60,475 | $0 | $0 |
| 2024 | -- | $60,475 | $12,000 | $48,475 |
| 2023 | $2,301 | $60,475 | $12,000 | $48,475 |
| 2022 | $2,368 | $60,475 | $12,000 | $48,475 |
| 2021 | $2,150 | $60,475 | $12,000 | $48,475 |
| 2020 | $1,725 | $60,475 | $12,000 | $48,475 |
| 2019 | $1,725 | $38,950 | $5,500 | $33,450 |
| 2018 | $1,686 | $38,950 | $5,500 | $33,450 |
| 2017 | $1,686 | $38,950 | $5,500 | $33,450 |
| 2016 | $1,671 | $38,950 | $5,500 | $33,450 |
| 2015 | $1,671 | $38,950 | $5,500 | $33,450 |
| 2014 | $1,468 | $37,459 | $0 | $0 |
Source: Public Records
Map
Nearby Homes