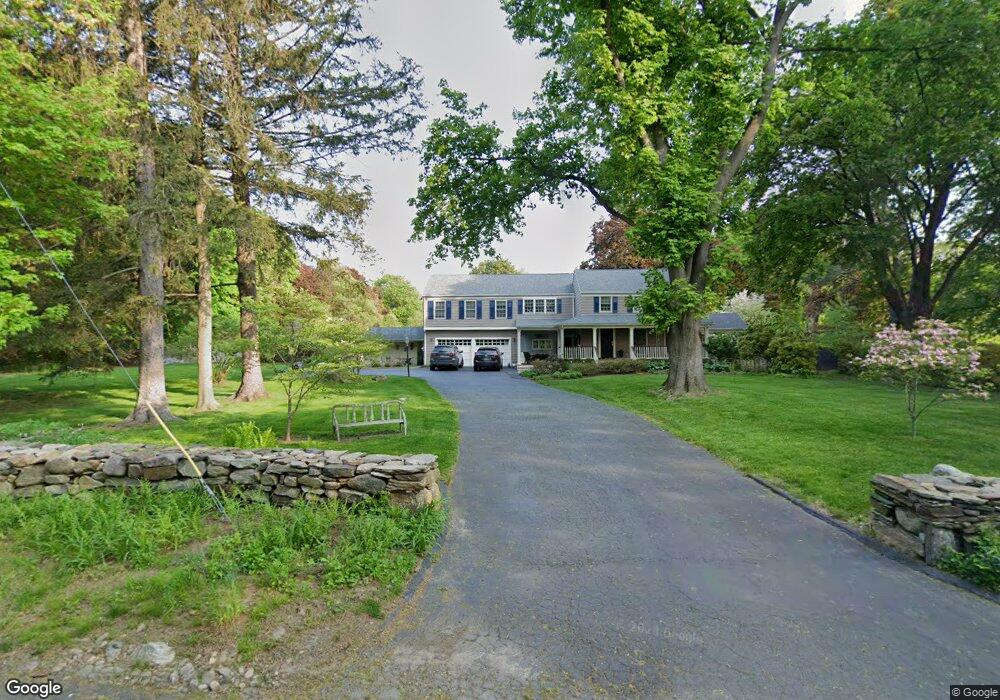
316 Hoydens Ln Fairfield, CT 06824
Greenfield Hill NeighborhoodEstimated Value: $1,104,000 - $1,564,000
4
Beds
3
Baths
3,291
Sq Ft
$401/Sq Ft
Est. Value
About This Home
This home is located at 316 Hoydens Ln, Fairfield, CT 06824 and is currently estimated at $1,321,081, approximately $401 per square foot. 316 Hoydens Ln is a home located in Fairfield County with nearby schools including Burr Elementary School, Tomlinson Middle School, and Fairfield Warde High School.
Ownership History
Date
Name
Owned For
Owner Type
Purchase Details
Closed on
Jul 16, 2019
Sold by
Bastien-Zeishler Yvonne
Bought by
Yvonne Zeisler T
Current Estimated Value
Purchase Details
Closed on
Feb 12, 2014
Sold by
Zeisler Stephen
Bought by
Zeisler Yvonne
Purchase Details
Closed on
Jul 2, 2010
Sold by
Zeisler Stephen F
Bought by
Zeisler Yvonne B
Purchase Details
Closed on
Oct 6, 1997
Sold by
Leblanc Phillippe
Bought by
Zeisler Stephen F and Zeisler Yvonne B
Purchase Details
Closed on
Aug 1, 1994
Sold by
Reich Thomas E and Reich Barbara
Bought by
Leblanc Philippe
Create a Home Valuation Report for This Property
The Home Valuation Report is an in-depth analysis detailing your home's value as well as a comparison with similar homes in the area
Home Values in the Area
Average Home Value in this Area
Purchase History
| Date | Buyer | Sale Price | Title Company |
|---|---|---|---|
| Yvonne Zeisler T | -- | -- | |
| Yvonne Zeisler T | -- | -- | |
| Zeisler Yvonne | -- | -- | |
| Zeisler Yvonne | -- | -- | |
| Zeisler Yvonne B | -- | -- | |
| Zeisler Yvonne B | -- | -- | |
| Zeisler Stephen F | $395,000 | -- | |
| Zeisler Stephen F | $395,000 | -- | |
| Leblanc Philippe | $328,000 | -- | |
| Leblanc Philippe | $328,000 | -- |
Source: Public Records
Mortgage History
| Date | Status | Borrower | Loan Amount |
|---|---|---|---|
| Previous Owner | Leblanc Philippe | $388,000 | |
| Previous Owner | Leblanc Philippe | $417,000 |
Source: Public Records
Tax History Compared to Growth
Tax History
| Year | Tax Paid | Tax Assessment Tax Assessment Total Assessment is a certain percentage of the fair market value that is determined by local assessors to be the total taxable value of land and additions on the property. | Land | Improvement |
|---|---|---|---|---|
| 2025 | $14,893 | $524,580 | $262,570 | $262,010 |
| 2024 | $14,636 | $524,580 | $262,570 | $262,010 |
| 2023 | $14,431 | $524,580 | $262,570 | $262,010 |
| 2022 | $14,290 | $524,580 | $262,570 | $262,010 |
| 2021 | $15,420 | $524,580 | $262,570 | $262,010 |
| 2020 | $16,655 | $621,670 | $334,250 | $287,420 |
| 2019 | $16,655 | $621,670 | $334,250 | $287,420 |
| 2018 | $16,387 | $621,670 | $334,250 | $287,420 |
| 2017 | $16,052 | $621,670 | $334,250 | $287,420 |
| 2016 | $15,822 | $621,670 | $334,250 | $287,420 |
| 2015 | $15,219 | $613,900 | $368,970 | $244,930 |
| 2014 | $14,979 | $613,900 | $368,970 | $244,930 |
Source: Public Records
Map
Nearby Homes
- 76 Hilary Cir Unit 76
- 342 Midlock Rd
- 312 Towne House Rd
- 39 Sunset Rd
- 71 Schiller Rd
- 48 Sunset Rd
- 178 Autumn Ridge Rd
- 38 Chester Rd
- 16 Manor Ln
- 273 Wheeler Park Ave
- 93 Tersana Dr
- 357 Harvester Rd
- 305 Sport Hill Rd
- 76 Burr St
- 251 Winnepoge Dr
- 264 Harvester Rd
- 2492 Congress St
- 26 Wendy Rd
- 68 High Ridge Rd
- 42 Wendy Rd
- 270 Hoydens Ln
- 230 Hoydens Ln
- 220 Hoydens Ln
- 160 Hoydens Ln
- 204 Hoydens Ln
- 181 Hoydens Ln
- 145 Hoydens Ln
- Lot A Stone Creek Estates
- 117 Hoydens Ln
- 120 Hoydens Ln
- 95 Hoydens Ln
- 562 Hoydens Ln
- 60 Hoydens Ln
- 600 Hoydens Ln
- 640 Rolling Hills Dr
- 2747 Morehouse Hwy
- 0 Hoydens Ln Unit 1
- 585 Hoydens Ln
- 630 Hoydens Ln
- 114 Morehouse Rd