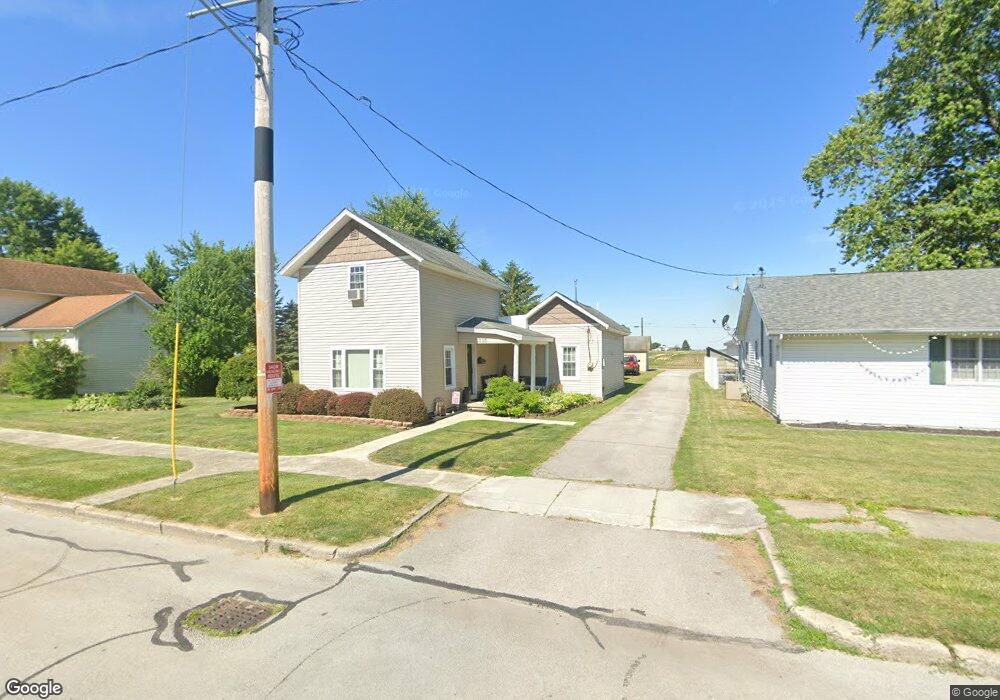
316 S 2nd St North Baltimore, OH 45872
Estimated Value: $146,000 - $157,000
3
Beds
2
Baths
1,776
Sq Ft
$84/Sq Ft
Est. Value
About This Home
This home is located at 316 S 2nd St, North Baltimore, OH 45872 and is currently estimated at $150,009, approximately $84 per square foot. 316 S 2nd St is a home located in Wood County with nearby schools including E.A. Powell Elementary School, North Baltimore Middle School, and North Baltimore High School.
Ownership History
Date
Name
Owned For
Owner Type
Purchase Details
Closed on
Oct 30, 2024
Sold by
Greeno Troy P and Greeno Heather C
Bought by
Greeno Troy P
Current Estimated Value
Home Financials for this Owner
Home Financials are based on the most recent Mortgage that was taken out on this home.
Original Mortgage
$136,163
Interest Rate
6.79%
Mortgage Type
FHA
Purchase Details
Closed on
Aug 2, 2007
Sold by
Greeno Heather C
Bought by
Greeno Troy P
Purchase Details
Closed on
Jul 8, 2007
Sold by
Torres Reuben A
Bought by
Greeno Heather C
Purchase Details
Closed on
Sep 28, 2006
Sold by
Torres Joe
Bought by
Greeno Heather C
Purchase Details
Closed on
May 5, 2006
Sold by
Estate Of Bacilio James Torres Jr
Bought by
Torres Reuben and Torres Joe
Purchase Details
Closed on
Jan 15, 2004
Sold by
Torres Cynthia and Bretz Cynthia K
Bought by
Torres Bacillo
Purchase Details
Closed on
Nov 23, 1983
Bought by
Torres Bacilio
Create a Home Valuation Report for This Property
The Home Valuation Report is an in-depth analysis detailing your home's value as well as a comparison with similar homes in the area
Home Values in the Area
Average Home Value in this Area
Purchase History
| Date | Buyer | Sale Price | Title Company |
|---|---|---|---|
| Greeno Troy P | -- | None Listed On Document | |
| Greeno Troy P | -- | None Available | |
| Greeno Heather C | -- | None Available | |
| Greeno Heather C | -- | None Available | |
| Torres Reuben | -- | None Available | |
| Torres Bacillo | -- | -- | |
| Torres Bacilio | $27,000 | -- |
Source: Public Records
Mortgage History
| Date | Status | Borrower | Loan Amount |
|---|---|---|---|
| Previous Owner | Greeno Troy P | $136,163 |
Source: Public Records
Tax History
| Year | Tax Paid | Tax Assessment Tax Assessment Total Assessment is a certain percentage of the fair market value that is determined by local assessors to be the total taxable value of land and additions on the property. | Land | Improvement |
|---|---|---|---|---|
| 2025 | $1,449 | $33,565 | $5,845 | $27,720 |
| 2024 | $1,498 | $33,565 | $5,845 | $27,720 |
| 2023 | $1,498 | $33,570 | $5,850 | $27,720 |
| 2021 | $1,459 | $27,870 | $4,450 | $23,420 |
| 2020 | $1,465 | $27,870 | $4,450 | $23,420 |
| 2019 | $1,350 | $23,810 | $4,450 | $19,360 |
| 2018 | $1,349 | $23,810 | $4,450 | $19,360 |
| 2017 | $1,322 | $23,810 | $4,450 | $19,360 |
| 2016 | $1,207 | $21,990 | $4,450 | $17,540 |
| 2015 | $1,248 | $21,990 | $4,450 | $17,540 |
| 2014 | $1,254 | $21,990 | $4,450 | $17,540 |
| 2013 | $1,444 | $21,990 | $4,450 | $17,540 |
Source: Public Records
Map
Nearby Homes
- 306 S Tarr St
- 222 High St
- 122 W Broadway St
- 128 Zihlman Ave
- 508 W Walnut St
- 409 N Main St
- 0 Eagleville Rd
- Lot 112 Foley Run
- 930 E Broadway St Unit Lot 43
- 930 E Broadway St Unit 170
- 0000 Eagleville Rd
- 3990 N Baltimore Rd
- 0 Oil Center Rd
- 117 S Main St
- 11755 State Route 613
- 205 E Walnut St
- 13923 Township Road 218
- 372 Township Rd 236
- 0 S Dixie Hwy
- 4014 County Road 139
Your Personal Tour Guide
Ask me questions while you tour the home.