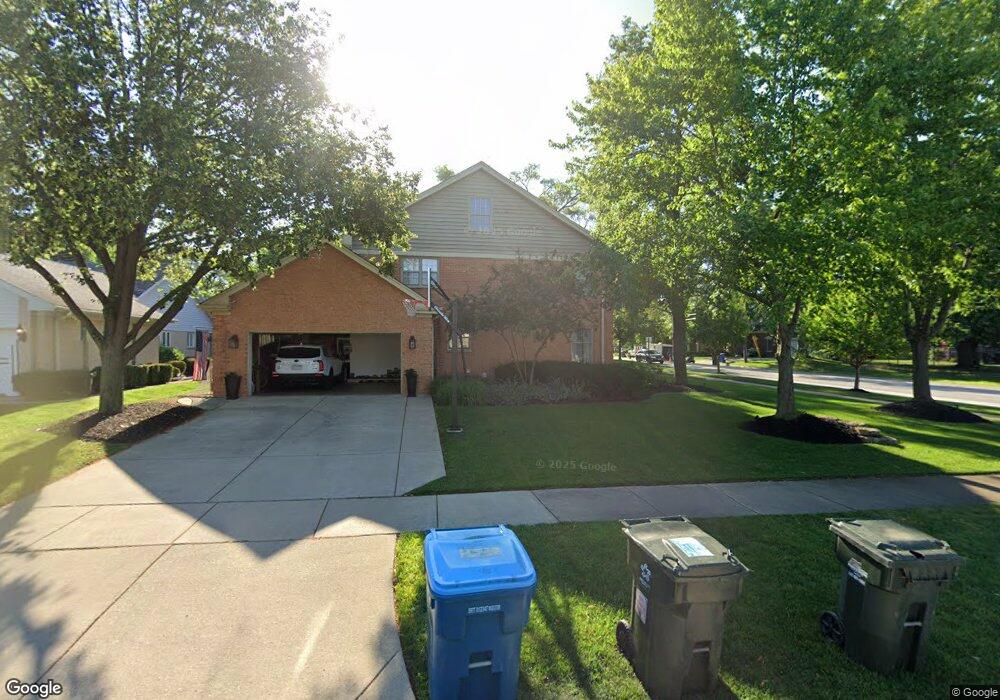
316 S Bobby Ln Mount Prospect, IL 60056
Estimated Value: $964,165 - $1,040,000
4
Beds
3
Baths
3,409
Sq Ft
$296/Sq Ft
Est. Value
About This Home
This home is located at 316 S Bobby Ln, Mount Prospect, IL 60056 and is currently estimated at $1,007,541, approximately $295 per square foot. 316 S Bobby Ln is a home located in Cook County with nearby schools including Lions Park Elementary School, Lincoln Middle School, and Prospect High School.
Ownership History
Date
Name
Owned For
Owner Type
Purchase Details
Closed on
Jan 15, 2013
Sold by
Minasian Michael E and Minasian Jean M
Bought by
Minasian Michael E and Minasian Jean M
Current Estimated Value
Purchase Details
Closed on
Dec 20, 2011
Sold by
Kloss Mark and Kloss Nancy
Bought by
Minasian Michael E and Minasian Jean M
Home Financials for this Owner
Home Financials are based on the most recent Mortgage that was taken out on this home.
Original Mortgage
$568,000
Interest Rate
3.92%
Mortgage Type
Stand Alone Second
Purchase Details
Closed on
Mar 1, 1999
Sold by
Schweihs Robert P and Schweihs Mary Beth
Bought by
Kloss Mark and Kloss Nancy
Home Financials for this Owner
Home Financials are based on the most recent Mortgage that was taken out on this home.
Original Mortgage
$385,000
Interest Rate
6.62%
Create a Home Valuation Report for This Property
The Home Valuation Report is an in-depth analysis detailing your home's value as well as a comparison with similar homes in the area
Home Values in the Area
Average Home Value in this Area
Purchase History
| Date | Buyer | Sale Price | Title Company |
|---|---|---|---|
| Minasian Michael E | -- | None Available | |
| Minasian Michael E | $710,000 | None Available | |
| Kloss Mark | $535,000 | -- |
Source: Public Records
Mortgage History
| Date | Status | Borrower | Loan Amount |
|---|---|---|---|
| Previous Owner | Minasian Michael E | $568,000 | |
| Previous Owner | Kloss Mark | $385,000 |
Source: Public Records
Tax History Compared to Growth
Tax History
| Year | Tax Paid | Tax Assessment Tax Assessment Total Assessment is a certain percentage of the fair market value that is determined by local assessors to be the total taxable value of land and additions on the property. | Land | Improvement |
|---|---|---|---|---|
| 2024 | $17,461 | $66,000 | $9,838 | $56,162 |
| 2023 | $16,761 | $66,000 | $9,838 | $56,162 |
| 2022 | $16,761 | $66,000 | $9,838 | $56,162 |
| 2021 | $15,286 | $52,389 | $6,394 | $45,995 |
| 2020 | $15,039 | $52,389 | $6,394 | $45,995 |
| 2019 | $15,024 | $58,211 | $6,394 | $51,817 |
| 2018 | $15,174 | $53,034 | $5,410 | $47,624 |
| 2017 | $15,867 | $55,099 | $5,410 | $49,689 |
| 2016 | $14,558 | $57,295 | $5,410 | $51,885 |
| 2015 | $14,445 | $52,323 | $4,427 | $47,896 |
| 2014 | $14,217 | $52,323 | $4,427 | $47,896 |
| 2013 | $14,187 | $52,323 | $4,427 | $47,896 |
Source: Public Records
Map
Nearby Homes
- 315 S We go Trail
- 1703 Bonita Ave
- 506 S Busse Rd
- 512 S Busse Rd
- 203 S See Gwun Ave
- 1703 W Robbie Ln
- 1720 W Robbie Ln
- 1615 E Central Rd Unit 417C
- 1326 W Central Rd
- 708 S Edgewood Ln
- 1405 E Central Rd Unit 122C
- 1505 E Central Rd Unit 303A
- 1415 E Central Rd Unit 301A
- 1415 E Central Rd Unit 219C
- 613 W Central Rd Unit B7
- 522 W Council Trail
- 701 W Central Rd Unit B3
- 904 S Edgewood Ln
- 1255 W Prospect Ave Unit 208
- 437 S Elmhurst Rd
- 315 S Bobby Ln
- 313 S Bobby Ln
- 1302 W Lincoln St
- 311 S Bobby Ln
- 1300 W Lincoln St
- 316 S Kenilworth Ave
- 314 S Bobby Ln
- 312 S Bobby Ln
- 1303 W Lincoln St
- 309 S Bobby Ln
- 314 S Kenilworth Ave
- 310 S Bobby Ln
- 1301 W Lincoln St
- 312 S Kenilworth Ave
- 308 S Bobby Ln
- 1206 W Lincoln St
- 307 S Bobby Ln
- 1209 W Pendleton Place
- 1213 W Lincoln St
- 310 S Kenilworth Ave