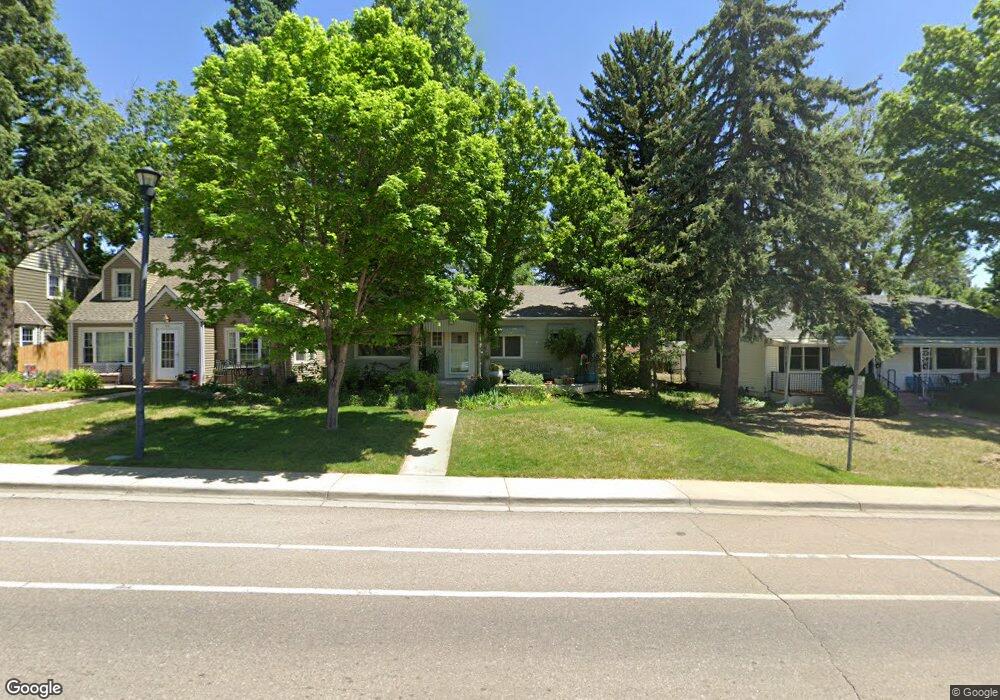
316 Sunset St Longmont, CO 80501
Sunset NeighborhoodEstimated Value: $543,740 - $694,000
3
Beds
2
Baths
1,975
Sq Ft
$313/Sq Ft
Est. Value
About This Home
This home is located at 316 Sunset St, Longmont, CO 80501 and is currently estimated at $618,185, approximately $313 per square foot. 316 Sunset St is a home located in Boulder County with nearby schools including Central Elementary School, Westview Middle School, and Longmont High School.
Ownership History
Date
Name
Owned For
Owner Type
Purchase Details
Closed on
Aug 9, 2016
Sold by
Mardick Bruce L
Bought by
Hall Marian L
Current Estimated Value
Home Financials for this Owner
Home Financials are based on the most recent Mortgage that was taken out on this home.
Original Mortgage
$83,000
Interest Rate
3.43%
Mortgage Type
New Conventional
Purchase Details
Closed on
Nov 26, 1985
Bought by
Hall Marian L
Purchase Details
Closed on
Jun 21, 1967
Bought by
Hall Marian L
Create a Home Valuation Report for This Property
The Home Valuation Report is an in-depth analysis detailing your home's value as well as a comparison with similar homes in the area
Home Values in the Area
Average Home Value in this Area
Purchase History
| Date | Buyer | Sale Price | Title Company |
|---|---|---|---|
| Hall Marian L | -- | Tiago Title Llc | |
| Hall Marian L | $95,000 | -- | |
| Hall Marian L | -- | -- |
Source: Public Records
Mortgage History
| Date | Status | Borrower | Loan Amount |
|---|---|---|---|
| Previous Owner | Hall Marian L | $83,000 |
Source: Public Records
Tax History Compared to Growth
Tax History
| Year | Tax Paid | Tax Assessment Tax Assessment Total Assessment is a certain percentage of the fair market value that is determined by local assessors to be the total taxable value of land and additions on the property. | Land | Improvement |
|---|---|---|---|---|
| 2025 | $2,380 | $32,606 | $9,181 | $23,425 |
| 2024 | $2,380 | $32,606 | $9,181 | $23,425 |
| 2023 | $2,980 | $31,584 | $10,311 | $24,958 |
| 2022 | $2,672 | $27,000 | $7,589 | $19,411 |
| 2021 | $2,707 | $27,778 | $7,808 | $19,970 |
| 2020 | $3,154 | $32,469 | $7,508 | $24,961 |
| 2019 | $3,104 | $32,469 | $7,508 | $24,961 |
| 2018 | $2,516 | $26,489 | $8,424 | $18,065 |
| 2017 | $2,482 | $29,285 | $9,313 | $19,972 |
| 2016 | $2,164 | $22,638 | $10,268 | $12,370 |
| 2015 | $2,062 | $19,796 | $7,721 | $12,075 |
| 2014 | $1,849 | $19,796 | $7,721 | $12,075 |
Source: Public Records
Map
Nearby Homes
- 1701 Short Place
- 159 Judson St
- 1421 Spruce Ave
- 1950 Spruce Ave
- 103 Sunset St Unit A
- 402 Sherman St
- 150 Francis St
- 813 Vivian St
- 1 Sherman Ct
- 305 Cottonwood Ct
- 1301 Spruce Ave
- 895 Faith Ct
- 207 Lincoln St
- 707 Longs Peak Ln
- 818 Lincoln St
- 301 Widgeon Ln
- 2103 Rangeview Ln
- 1129 2nd Ave
- 822 Hover St
- 715 Hover St