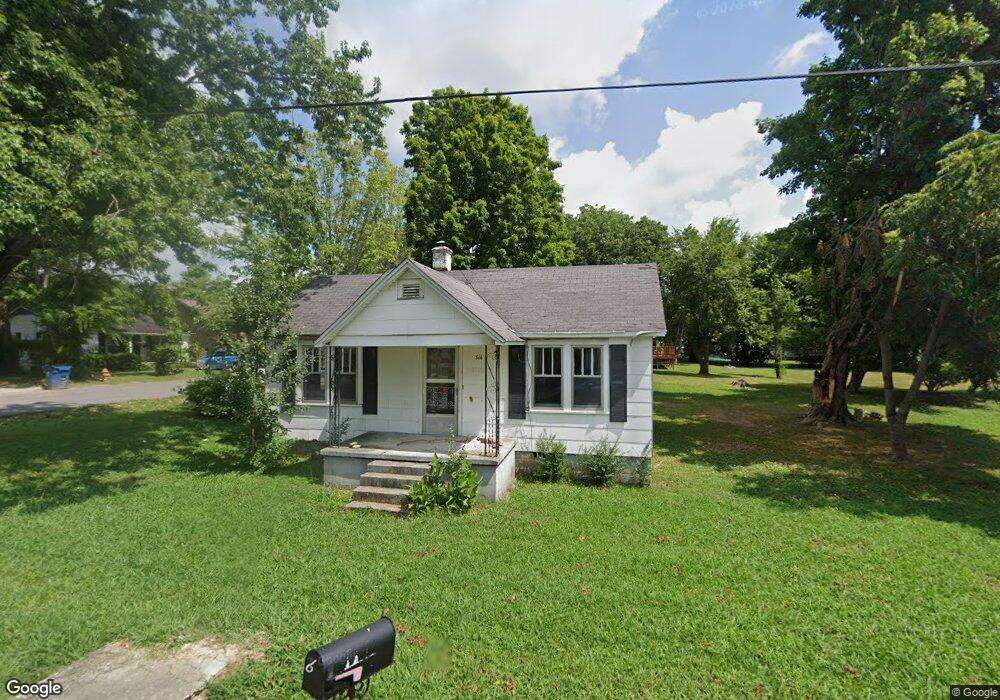
316 W Coffee St Manchester, TN 37355
Estimated Value: $130,000 - $161,000
--
Bed
1
Bath
936
Sq Ft
$156/Sq Ft
Est. Value
About This Home
This home is located at 316 W Coffee St, Manchester, TN 37355 and is currently estimated at $146,004, approximately $155 per square foot. 316 W Coffee St is a home located in Coffee County with nearby schools including Westwood Middle School.
Ownership History
Date
Name
Owned For
Owner Type
Purchase Details
Closed on
Jan 17, 2020
Sold by
Parker Ray Donald
Bought by
Ramirez Lafredo
Current Estimated Value
Home Financials for this Owner
Home Financials are based on the most recent Mortgage that was taken out on this home.
Original Mortgage
$34,500
Outstanding Balance
$32,048
Interest Rate
6.75%
Mortgage Type
Adjustable Rate Mortgage/ARM
Estimated Equity
$113,956
Purchase Details
Closed on
Jun 13, 2008
Sold by
Parsley Margaret Lucille
Bought by
Parker Ray Donald
Create a Home Valuation Report for This Property
The Home Valuation Report is an in-depth analysis detailing your home's value as well as a comparison with similar homes in the area
Home Values in the Area
Average Home Value in this Area
Purchase History
| Date | Buyer | Sale Price | Title Company |
|---|---|---|---|
| Ramirez Lafredo | $45,000 | Bell & Alexander Ttl Svcs In | |
| Parker Ray Donald | -- | None Available | |
| Parker Ray Donald | $50,000 | -- |
Source: Public Records
Mortgage History
| Date | Status | Borrower | Loan Amount |
|---|---|---|---|
| Open | Ramirez Lafredo | $34,500 |
Source: Public Records
Tax History Compared to Growth
Tax History
| Year | Tax Paid | Tax Assessment Tax Assessment Total Assessment is a certain percentage of the fair market value that is determined by local assessors to be the total taxable value of land and additions on the property. | Land | Improvement |
|---|---|---|---|---|
| 2024 | $458 | $10,850 | $3,000 | $7,850 |
| 2023 | $458 | $10,850 | $0 | $0 |
| 2022 | $394 | $10,850 | $3,000 | $7,850 |
| 2021 | $513 | $11,200 | $2,500 | $8,700 |
| 2020 | $513 | $11,200 | $2,500 | $8,700 |
| 2019 | $513 | $11,200 | $2,500 | $8,700 |
| 2018 | $513 | $11,200 | $2,500 | $8,700 |
| 2017 | $536 | $10,225 | $2,500 | $7,725 |
| 2016 | $536 | $10,225 | $2,500 | $7,725 |
| 2015 | $536 | $10,225 | $2,500 | $7,725 |
| 2014 | $536 | $10,224 | $0 | $0 |
Source: Public Records
Map
Nearby Homes