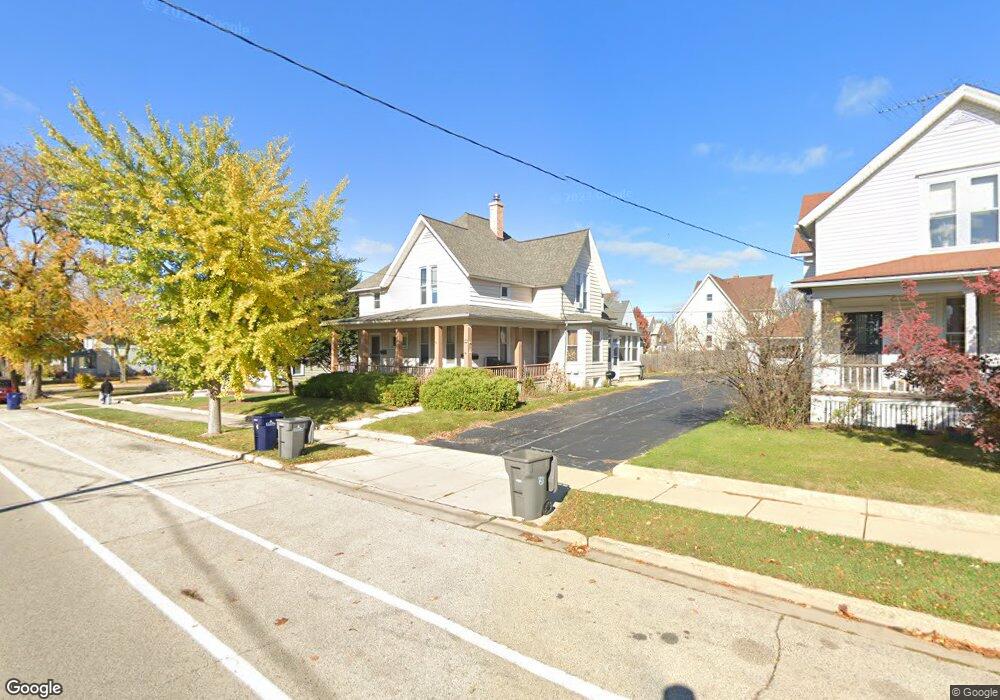
316 Walnut Ave Elgin, IL 60123
Near West Elgin NeighborhoodEstimated Value: $302,035 - $354,000
4
Beds
3
Baths
2,070
Sq Ft
$159/Sq Ft
Est. Value
About This Home
This home is located at 316 Walnut Ave, Elgin, IL 60123 and is currently estimated at $328,509, approximately $158 per square foot. 316 Walnut Ave is a home located in Kane County with nearby schools including Lowrie Elementary School, Abbott Middle School, and Larkin High School.
Ownership History
Date
Name
Owned For
Owner Type
Purchase Details
Closed on
May 20, 2005
Sold by
Soto Javier E
Bought by
Haacker Craig and Haacker Mandy
Current Estimated Value
Home Financials for this Owner
Home Financials are based on the most recent Mortgage that was taken out on this home.
Original Mortgage
$184,100
Outstanding Balance
$92,328
Interest Rate
5.25%
Mortgage Type
Purchase Money Mortgage
Estimated Equity
$236,181
Purchase Details
Closed on
Jun 30, 2004
Sold by
Jensen Donald C and Jensen Hattie M
Bought by
Soto Javier E
Home Financials for this Owner
Home Financials are based on the most recent Mortgage that was taken out on this home.
Original Mortgage
$191,200
Interest Rate
6.37%
Mortgage Type
New Conventional
Purchase Details
Closed on
Jan 14, 1997
Sold by
Jensen Donald C and Jensen Hattie M
Bought by
Jensen Donald C and Jensen Hattie M
Create a Home Valuation Report for This Property
The Home Valuation Report is an in-depth analysis detailing your home's value as well as a comparison with similar homes in the area
Home Values in the Area
Average Home Value in this Area
Purchase History
| Date | Buyer | Sale Price | Title Company |
|---|---|---|---|
| Haacker Craig | $263,000 | Law Title Insurance | |
| Soto Javier E | $239,000 | Chicago Title Insurance Comp | |
| Jensen Donald C | -- | -- |
Source: Public Records
Mortgage History
| Date | Status | Borrower | Loan Amount |
|---|---|---|---|
| Open | Haacker Craig | $184,100 | |
| Previous Owner | Soto Javier E | $191,200 | |
| Closed | Haacker Craig | $52,600 |
Source: Public Records
Tax History
| Year | Tax Paid | Tax Assessment Tax Assessment Total Assessment is a certain percentage of the fair market value that is determined by local assessors to be the total taxable value of land and additions on the property. | Land | Improvement |
|---|---|---|---|---|
| 2024 | $6,659 | $83,205 | $15,521 | $67,684 |
| 2023 | $6,408 | $75,169 | $14,022 | $61,147 |
| 2022 | $5,504 | $63,472 | $12,786 | $50,686 |
| 2021 | $5,294 | $59,342 | $11,954 | $47,388 |
| 2020 | $5,167 | $56,651 | $11,412 | $45,239 |
| 2019 | $5,040 | $53,964 | $10,871 | $43,093 |
| 2018 | $5,026 | $50,837 | $10,241 | $40,596 |
| 2017 | $4,943 | $48,059 | $9,681 | $38,378 |
| 2016 | $4,755 | $44,585 | $8,981 | $35,604 |
| 2015 | -- | $40,866 | $8,232 | $32,634 |
| 2014 | -- | $40,361 | $8,130 | $32,231 |
| 2013 | -- | $41,425 | $8,344 | $33,081 |
Source: Public Records
Map
Nearby Homes
- 455 Walnut Ave
- 7 National St Unit 7
- 208 Moseley St
- 331 Orange St
- 552 Walnut Ave
- 96 S Crystal St
- 50 S State St
- 216 Prairie St
- 9 N Jackson St
- 315 Vandalia St
- 761 South St
- 756 Walnut Ave
- 277 Gifford Place
- 50 Sheridan St
- 251 Bartlett Place
- 353 Wilcox Ave
- 118 Wilcox Ave
- 800 Morgan St
- 332-334 St Charles St
- 518 Raymond St
- 322 Walnut Ave
- 308 Walnut Ave
- 326 Walnut Ave
- 315 Standish St
- 321 Standish St
- 309 Standish St
- 304 Walnut Ave
- 325 Standish St
- 303 Standish St
- 317 Walnut Ave
- 325 Walnut Ave
- 271 Walnut Ave
- 327 Walnut Ave
- 350 Walnut Ave
- 331 Walnut Ave
- 267 Walnut Ave
- 351 Standish St
- 256 Walnut Ave
- 263 Walnut Ave
- 335 Walnut Ave
Your Personal Tour Guide
Ask me questions while you tour the home.