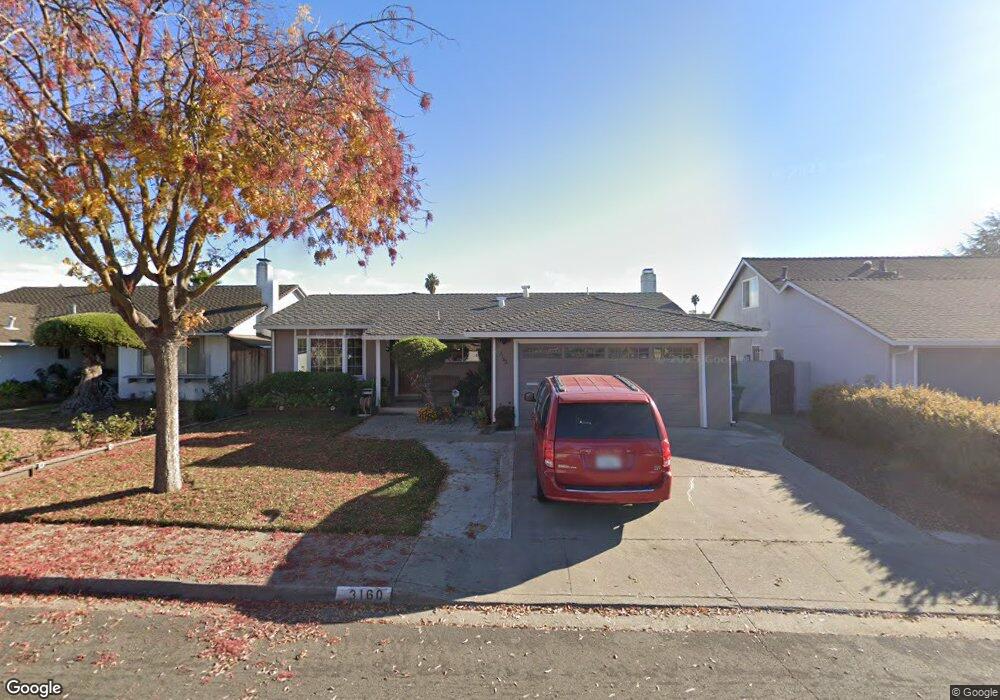
3160 San Gabriel Way Union City, CA 94587
Alvarado NeighborhoodEstimated Value: $680,000 - $1,391,000
3
Beds
2
Baths
1,396
Sq Ft
$801/Sq Ft
Est. Value
About This Home
This home is located at 3160 San Gabriel Way, Union City, CA 94587 and is currently estimated at $1,118,174, approximately $800 per square foot. 3160 San Gabriel Way is a home located in Alameda County with nearby schools including Alvarado Elementary School, Itliong-Vera Cruz, and James Logan High School.
Ownership History
Date
Name
Owned For
Owner Type
Purchase Details
Closed on
Jan 26, 2009
Sold by
Blanco Celerina Y and Blanco Bernadette Y
Bought by
Blanco Celerina Y
Current Estimated Value
Home Financials for this Owner
Home Financials are based on the most recent Mortgage that was taken out on this home.
Original Mortgage
$246,000
Outstanding Balance
$155,834
Interest Rate
5.14%
Mortgage Type
Purchase Money Mortgage
Estimated Equity
$962,340
Purchase Details
Closed on
Sep 28, 2004
Sold by
Blanco Venancio G
Bought by
Blanco Celerina Y
Purchase Details
Closed on
Nov 4, 2003
Sold by
Blanco Venancio G and Blanco Celerina Y
Bought by
Blanco Celerina Y
Home Financials for this Owner
Home Financials are based on the most recent Mortgage that was taken out on this home.
Original Mortgage
$130,000
Interest Rate
5.72%
Mortgage Type
Purchase Money Mortgage
Create a Home Valuation Report for This Property
The Home Valuation Report is an in-depth analysis detailing your home's value as well as a comparison with similar homes in the area
Home Values in the Area
Average Home Value in this Area
Purchase History
| Date | Buyer | Sale Price | Title Company |
|---|---|---|---|
| Blanco Celerina Y | $123,000 | Multiple | |
| Blanco Celerina Y | -- | Multiple | |
| Blanco Celerina Y | -- | -- | |
| Blanco Celerina Y | -- | -- | |
| Blanco Celerina Y | -- | New Century Title Company |
Source: Public Records
Mortgage History
| Date | Status | Borrower | Loan Amount |
|---|---|---|---|
| Open | Blanco Celerina Y | $246,000 | |
| Closed | Blanco Celerina Y | $130,000 |
Source: Public Records
Tax History Compared to Growth
Tax History
| Year | Tax Paid | Tax Assessment Tax Assessment Total Assessment is a certain percentage of the fair market value that is determined by local assessors to be the total taxable value of land and additions on the property. | Land | Improvement |
|---|---|---|---|---|
| 2025 | $4,482 | $236,697 | $78,092 | $165,605 |
| 2024 | $4,482 | $231,919 | $76,561 | $162,358 |
| 2023 | $4,286 | $234,234 | $75,060 | $159,174 |
| 2022 | $4,182 | $222,642 | $73,588 | $156,054 |
| 2021 | $4,086 | $218,140 | $72,146 | $152,994 |
| 2020 | $4,044 | $222,831 | $71,406 | $151,425 |
| 2019 | $4,064 | $218,463 | $70,006 | $148,457 |
| 2018 | $3,964 | $214,180 | $68,634 | $145,546 |
| 2017 | $3,865 | $209,981 | $67,288 | $142,693 |
| 2016 | $3,728 | $205,864 | $65,969 | $139,895 |
| 2015 | $3,649 | $202,772 | $64,978 | $137,794 |
| 2014 | $3,511 | $198,800 | $63,705 | $135,095 |
Source: Public Records
Map
Nearby Homes
- 3280 Grand Lake Dr
- 32542 Lake Tana St
- 30996 Granger Ave
- 4167 Sunflower Ct
- 3142 Sugar Beet Way
- 2544 Franklin Ave Unit 172
- 2155 Eric Ct Unit 3
- 3011 Risdon Dr Unit 8
- 30784 Tidewater Dr
- 4263 Queen Anne Dr
- 4214 Saturn Way
- 4243 Comet Cir
- 2955 Risdon Dr Unit 88
- 32814 Shaver Lake St
- 3058 Flint St Unit 40
- 3501 Lake Ontario Dr
- 32625 Brenda Way Unit 1
- 31226 Lily St
- 30300 Meridien Cir
- 33010 Lake Mead Dr
- 3156 San Gabriel Way
- 3164 San Gabriel Way
- 3159 San Rafael Way
- 3152 San Gabriel Way
- 3168 San Gabriel Way
- 3163 San Rafael Way
- 3155 San Rafael Way
- 3155 San Gabriel Way
- 3167 San Rafael Way
- 3151 San Rafael Way
- 3159 San Gabriel Way
- 3151 San Gabriel Way
- 3148 San Gabriel Way
- 3172 San Gabriel Way
- 3163 San Gabriel Way
- 3147 San Gabriel Way
- 3171 San Rafael Way
- 3147 San Rafael Way
- 3167 San Gabriel Way
- 3143 San Gabriel Way