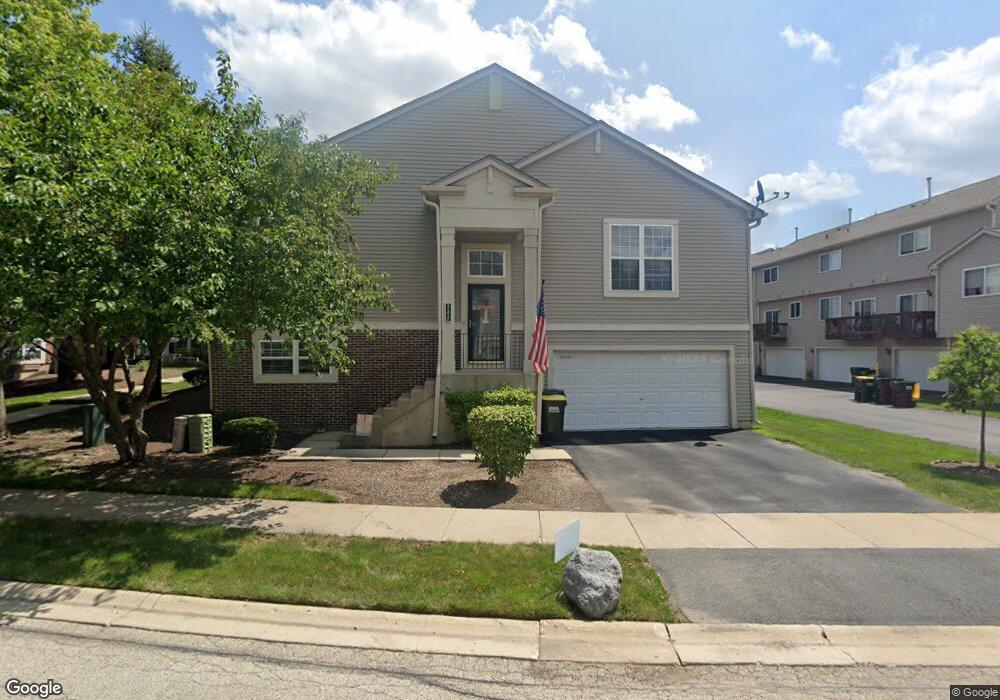
31617 Tall Grass Ct Unit 102-1 Lakemoor, IL 60051
East Lakemoor NeighborhoodEstimated Value: $242,000 - $266,000
3
Beds
3
Baths
1,106
Sq Ft
$229/Sq Ft
Est. Value
About This Home
This home is located at 31617 Tall Grass Ct Unit 102-1, Lakemoor, IL 60051 and is currently estimated at $252,957, approximately $228 per square foot. 31617 Tall Grass Ct Unit 102-1 is a home located in Lake County with nearby schools including Robert Crown School, Matthews Middle School, and Wauconda High School.
Ownership History
Date
Name
Owned For
Owner Type
Purchase Details
Closed on
Dec 3, 2019
Sold by
North Shore Holdings Ltd
Bought by
North Shore Propco Llc
Current Estimated Value
Purchase Details
Closed on
May 16, 2016
Sold by
Mendoza
Bought by
North Shore Holdings Ltd
Purchase Details
Closed on
Jan 26, 2004
Sold by
Mendoza Ivan and Ortiz Maria Lourdes
Bought by
Mendoza Ivan
Home Financials for this Owner
Home Financials are based on the most recent Mortgage that was taken out on this home.
Original Mortgage
$194,479
Interest Rate
5.91%
Mortgage Type
FHA
Purchase Details
Closed on
Aug 20, 2002
Sold by
The Pines Llc
Bought by
Mendoza Ivan and Ortiz Maria Lourdes
Home Financials for this Owner
Home Financials are based on the most recent Mortgage that was taken out on this home.
Original Mortgage
$189,551
Interest Rate
6.23%
Mortgage Type
FHA
Create a Home Valuation Report for This Property
The Home Valuation Report is an in-depth analysis detailing your home's value as well as a comparison with similar homes in the area
Home Values in the Area
Average Home Value in this Area
Purchase History
| Date | Buyer | Sale Price | Title Company |
|---|---|---|---|
| North Shore Propco Llc | -- | Old Republic Title | |
| North Shore Holdings Ltd | $100,301 | Attorney | |
| Mendoza Ivan | -- | Stewart Title Company | |
| Mendoza Ivan | $192,500 | -- |
Source: Public Records
Mortgage History
| Date | Status | Borrower | Loan Amount |
|---|---|---|---|
| Previous Owner | Mendoza Ivan | $194,479 | |
| Previous Owner | Mendoza Ivan | $189,551 |
Source: Public Records
Tax History Compared to Growth
Tax History
| Year | Tax Paid | Tax Assessment Tax Assessment Total Assessment is a certain percentage of the fair market value that is determined by local assessors to be the total taxable value of land and additions on the property. | Land | Improvement |
|---|---|---|---|---|
| 2024 | $5,401 | $69,508 | $7,010 | $62,498 |
| 2023 | $4,411 | $63,536 | $6,408 | $57,128 |
| 2022 | $4,411 | $46,897 | $4,484 | $42,413 |
| 2021 | $4,533 | $47,465 | $4,237 | $43,228 |
| 2020 | $4,391 | $45,239 | $4,038 | $41,201 |
| 2019 | $3,870 | $42,755 | $3,816 | $38,939 |
| 2018 | $3,326 | $33,377 | $5,501 | $27,876 |
| 2017 | $3,324 | $32,991 | $5,437 | $27,554 |
| 2016 | $2,564 | $31,242 | $5,149 | $26,093 |
| 2015 | $2,432 | $28,681 | $4,727 | $23,954 |
| 2014 | $3,265 | $36,926 | $6,099 | $30,827 |
| 2012 | $3,207 | $37,591 | $6,209 | $31,382 |
Source: Public Records
Map
Nearby Homes
- 28744 W Pondview Dr Unit 28744
- 28794 W Pondview Dr
- 28676 W Schlesser Dr
- 104 Morningside Dr
- 95 W South Dr
- 135 Lotus Dr
- 236 Venice Rd
- 31918 Hillside Dr
- 32004 Savannah Dr
- 32069 Savannah Dr
- 32006 W Savannah Dr
- 32012 Savannah Dr
- 32016 Savannah Dr
- 32018 Savannah Dr
- 32060 Savannah Dr
- 32022 Savannah Dr
- 28200 W Il Route 120
- 336 Rosedale Dr
- 32111 N Great Plaines Ave
- 32108 N Rockwell Dr
- 31617 Tallgrass Ct Unit 102-1
- 31617 Tallgrass Ct
- 31617 Tall Grass Ct
- 31615 Tall Grass Ct
- 31613 Tall Grass Ct
- 31611 Tall Grass Ct
- 31601 Tall Grass Ct
- 31609 Tall Grass Ct
- 31607 Tall Grass Ct
- 31599 Tall Grass Ct
- 31631 Tallgrass Ct Unit 31631
- 31633 Tall Grass Ct
- 31597 Tall Grass Ct
- 31607 Tallgrass Ct
- 31606 Tall Grass Ct
- 31631 Tall Grass Ct
- 31593 Tall Grass Ct
- 31595 Tall Grass Ct
- 31606 Tallgrass Ct
- 31629 Tall Grass Ct