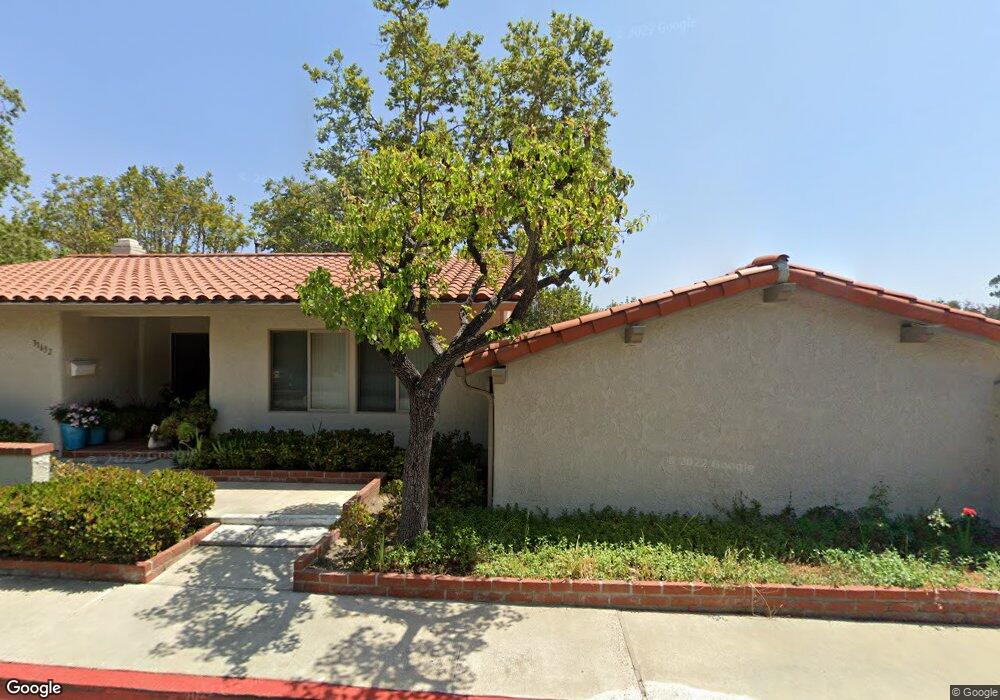
31636 W Nine Dr Laguna Niguel, CA 92677
Estimated Value: $725,276 - $777,000
2
Beds
2
Baths
1,045
Sq Ft
$709/Sq Ft
Est. Value
About This Home
This home is located at 31636 W Nine Dr, Laguna Niguel, CA 92677 and is currently estimated at $740,569, approximately $708 per square foot. 31636 W Nine Dr is a home located in Orange County with nearby schools including Moulton Elementary, Niguel Hills Middle School, and Dana Hills High School.
Ownership History
Date
Name
Owned For
Owner Type
Purchase Details
Closed on
Mar 25, 2019
Sold by
Flesner David H and Flesner Pamela A
Bought by
Flesner Pamela A and Flesner David H
Current Estimated Value
Purchase Details
Closed on
Oct 12, 2017
Sold by
The Mary Joanne Cimmarrusti Irrevocable
Bought by
Fesner David H and Fesner Pamela A
Purchase Details
Closed on
Jan 4, 2007
Sold by
Cimmarrusti Mary Joanne and Cimmarrusti Mary J
Bought by
Cimmarrusti Mary Joanne and The Cimmarrusti Family Trust
Purchase Details
Closed on
Feb 25, 1999
Sold by
Bartolme Barbara G
Bought by
Cimmarrusti Rocco and Cimmarrusti Mary J
Home Financials for this Owner
Home Financials are based on the most recent Mortgage that was taken out on this home.
Original Mortgage
$120,000
Interest Rate
6.73%
Create a Home Valuation Report for This Property
The Home Valuation Report is an in-depth analysis detailing your home's value as well as a comparison with similar homes in the area
Home Values in the Area
Average Home Value in this Area
Purchase History
| Date | Buyer | Sale Price | Title Company |
|---|---|---|---|
| Flesner Pamela A | -- | None Available | |
| Fesner David H | $470,000 | None Available | |
| Cimmarrusti Mary Joanne | -- | None Available | |
| Cimmarrusti Rocco | $171,000 | Chicago Title Co |
Source: Public Records
Mortgage History
| Date | Status | Borrower | Loan Amount |
|---|---|---|---|
| Previous Owner | Cimmarrusti Rocco | $120,000 |
Source: Public Records
Tax History Compared to Growth
Tax History
| Year | Tax Paid | Tax Assessment Tax Assessment Total Assessment is a certain percentage of the fair market value that is determined by local assessors to be the total taxable value of land and additions on the property. | Land | Improvement |
|---|---|---|---|---|
| 2025 | $5,319 | $534,777 | $438,736 | $96,041 |
| 2024 | $5,319 | $524,292 | $430,134 | $94,158 |
| 2023 | $5,207 | $514,012 | $421,700 | $92,312 |
| 2022 | $5,108 | $503,934 | $413,432 | $90,502 |
| 2021 | $5,009 | $494,053 | $405,325 | $88,728 |
| 2020 | $4,959 | $488,988 | $401,169 | $87,819 |
| 2019 | $4,862 | $479,400 | $393,302 | $86,098 |
| 2018 | $4,769 | $470,000 | $385,590 | $84,410 |
| 2017 | $2,280 | $230,980 | $131,280 | $99,700 |
| 2016 | $2,235 | $226,451 | $128,705 | $97,746 |
| 2015 | $2,201 | $223,050 | $126,772 | $96,278 |
| 2014 | $2,157 | $218,681 | $124,288 | $94,393 |
Source: Public Records
Map
Nearby Homes
- 31601 E Nine Dr Unit 59F
- 31605 E Nine Dr Unit 61F
- 31386 W Nine Dr
- 31811 E Nine Dr
- 31421 E Nine Dr
- 31802 Isle Royal Dr
- 55 S Peak
- 31281 E Nine Dr Unit 25F
- 31358 Flying Cloud Dr
- 23002 Via Cruz
- 31621 Crystal Sands Dr
- 18 Woodhaven Dr
- 22981 Via Cruz
- 32182 Links Pointe
- 22902 Via Cruz
- 22876 Montalvo Rd
- 32072 Sea Island Dr
- 23414 Highcrest Rd
- 31731 Isle Vista
- 32221 Azores Rd
- 31636 W Nine Dr Unit B111
- 31634 W Nine Dr
- 31642 W Nine Dr Unit RB113
- 31638 W Nine Dr Unit RA112
- 31638 W Nine Dr
- 31624 W Nine Dr Unit GL109
- 31624 W Nine Dr
- 31644 W Nine Dr Unit A114
- 31644 W Nine Dr
- 31622 W Nine Dr
- 31622 W Nine Dr Unit F108
- 31646 W Nine Dr Unit B115
- 31618 W Nine Dr
- 31648 W Nine Dr Unit F116
- 31648 W Nine Dr
- 31616 W Nine Dr Unit A106
- 31652 W Nine Dr Unit GL117
- 31652 W Nine Dr
- 31614 W Nine Dr Unit RB105
- 31614 W Nine Dr Unit Rb10