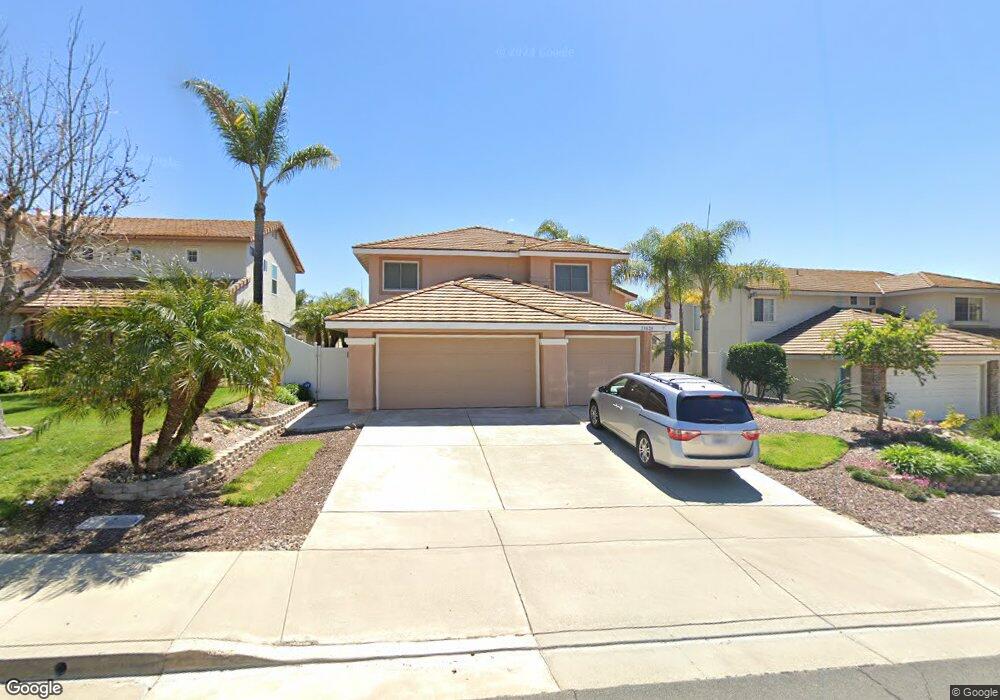
31639 Via San Carlos Temecula, CA 92592
Redhawk NeighborhoodEstimated Value: $758,775 - $814,000
4
Beds
3
Baths
2,409
Sq Ft
$327/Sq Ft
Est. Value
About This Home
This home is located at 31639 Via San Carlos, Temecula, CA 92592 and is currently estimated at $788,444, approximately $327 per square foot. 31639 Via San Carlos is a home located in Riverside County with nearby schools including Red Hawk Elementary, Erle Stanley Gardner Middle School, and Great Oak High School.
Ownership History
Date
Name
Owned For
Owner Type
Purchase Details
Closed on
Dec 16, 2009
Sold by
Durcan Jonathan P and Durcan Laura
Bought by
Durcan Jonathan P and Durcan Laura
Current Estimated Value
Purchase Details
Closed on
Jul 2, 1998
Sold by
Cole Larry D and Cole Cheryin I
Bought by
Durcan Jonathan P and Durcan Laura
Home Financials for this Owner
Home Financials are based on the most recent Mortgage that was taken out on this home.
Original Mortgage
$144,950
Interest Rate
6.88%
Mortgage Type
Purchase Money Mortgage
Purchase Details
Closed on
Dec 5, 1995
Sold by
The Presley Companies
Bought by
Cole Larry D and Cole Cherylni
Home Financials for this Owner
Home Financials are based on the most recent Mortgage that was taken out on this home.
Original Mortgage
$163,098
Interest Rate
7.37%
Mortgage Type
VA
Create a Home Valuation Report for This Property
The Home Valuation Report is an in-depth analysis detailing your home's value as well as a comparison with similar homes in the area
Home Values in the Area
Average Home Value in this Area
Purchase History
| Date | Buyer | Sale Price | Title Company |
|---|---|---|---|
| Durcan Jonathan P | -- | None Available | |
| Durcan Jonathan P | -- | None Available | |
| Durcan Jonathan P | $190,000 | Old Republic Title Company | |
| Cole Larry D | $160,000 | First American Title Ins Co |
Source: Public Records
Mortgage History
| Date | Status | Borrower | Loan Amount |
|---|---|---|---|
| Previous Owner | Durcan Jonathan P | $144,950 | |
| Previous Owner | Cole Larry D | $163,098 |
Source: Public Records
Tax History Compared to Growth
Tax History
| Year | Tax Paid | Tax Assessment Tax Assessment Total Assessment is a certain percentage of the fair market value that is determined by local assessors to be the total taxable value of land and additions on the property. | Land | Improvement |
|---|---|---|---|---|
| 2025 | $3,939 | $326,685 | $62,688 | $263,997 |
| 2023 | $3,939 | $314,001 | $60,254 | $253,747 |
| 2022 | $3,812 | $307,845 | $59,073 | $248,772 |
| 2021 | $3,728 | $301,810 | $57,915 | $243,895 |
| 2020 | $3,678 | $298,717 | $57,322 | $241,395 |
| 2019 | $3,629 | $292,861 | $56,199 | $236,662 |
| 2018 | $3,555 | $287,120 | $55,099 | $232,021 |
| 2017 | $3,489 | $281,491 | $54,019 | $227,472 |
| 2016 | $3,422 | $275,972 | $52,960 | $223,012 |
| 2015 | $3,360 | $271,828 | $52,165 | $219,663 |
| 2014 | $3,257 | $266,506 | $51,145 | $215,361 |
Source: Public Records
Map
Nearby Homes
- 31593 Calle Los Padres
- 44624 Clover Ln
- 31251 Strawberry Tree Ln
- 45495 Peacock Place
- 45501 Jaguar Way
- 31409 Taylor Ln
- 31376 Taylor Ln
- 31191 Mountain Lilac Way
- 44989 Bellflower Ln
- 31186 Lavender Ct Unit 164
- 44984 Hawthorn St Unit 208
- 31937 Corte Montoya
- 31163 Lavender Ct
- 31938 Calle Tiara S
- 31281 David Ln
- 32122 Corte Eldorado
- 31941 Calle Tiara S
- 45590 Alpine Place
- 45723 Pheasant Place
- 31054 Strawberry Tree Ln Unit 5
- 31647 Via San Carlos
- 31627 Via San Carlos
- 45004 Corte Alegra
- 31659 Via San Carlos
- 31619 Via San Carlos
- 44998 Corte Alegra
- 31667 Via San Carlos
- 31634 Via San Carlos
- 45010 Corte Alegra
- 31607 Via San Carlos
- 31622 Via San Carlos
- 44997 Corte Christina
- 45001 Corte Alegra
- 45003 Corte Christina
- 31679 Via San Carlos
- 31614 Via San Carlos
- 31599 Via San Carlos
- 45016 Corte Alegra
- 31658 Via San Carlos
- 31602 Via San Carlos