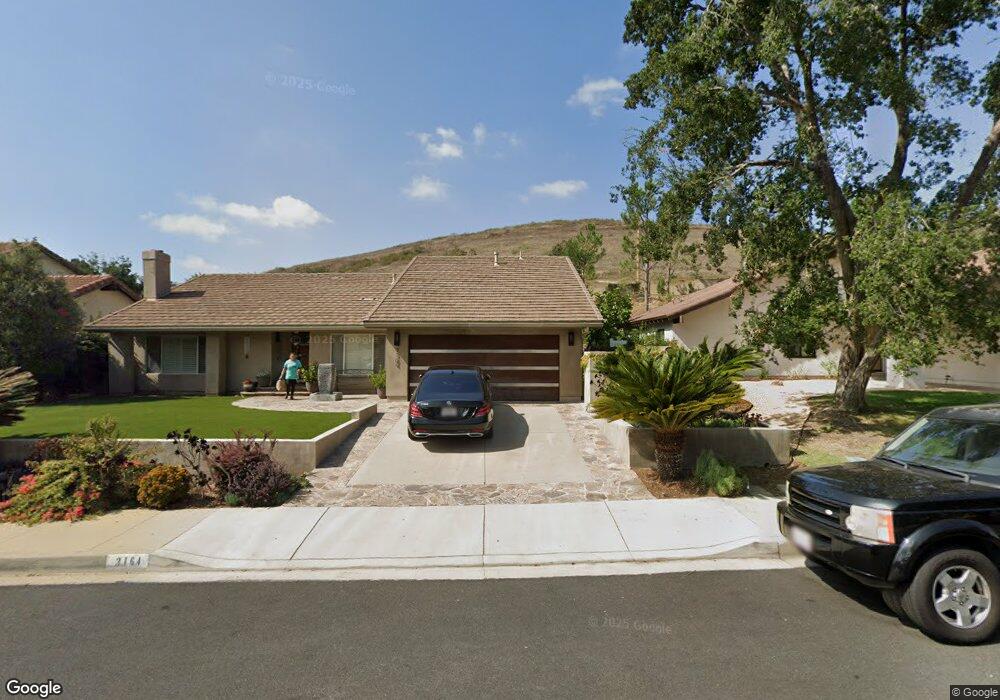
3164 Sierra Dr Westlake Village, CA 91362
Estimated Value: $1,175,000 - $1,406,000
3
Beds
2
Baths
1,699
Sq Ft
$760/Sq Ft
Est. Value
About This Home
This home is located at 3164 Sierra Dr, Westlake Village, CA 91362 and is currently estimated at $1,290,879, approximately $759 per square foot. 3164 Sierra Dr is a home located in Ventura County with nearby schools including Westlake Hills Elementary School, Colina Middle School, and Westlake High School.
Ownership History
Date
Name
Owned For
Owner Type
Purchase Details
Closed on
Sep 16, 2002
Sold by
Mcmaster Donald R and Mcmaster Karen L
Bought by
Mcmaster Ii Donald R and Mcmaster Karen L
Current Estimated Value
Purchase Details
Closed on
Jun 18, 1996
Sold by
Rodriguez Robert C and Rodriguez Tracy A
Bought by
Mcmaster Ii Donald R and Mcmaster Karen L
Home Financials for this Owner
Home Financials are based on the most recent Mortgage that was taken out on this home.
Original Mortgage
$223,200
Outstanding Balance
$13,937
Interest Rate
7.75%
Estimated Equity
$1,276,942
Purchase Details
Closed on
Feb 28, 1995
Sold by
Brook Marsha
Bought by
Rodriguez Robert C and Rodriguez Tracy A
Home Financials for this Owner
Home Financials are based on the most recent Mortgage that was taken out on this home.
Original Mortgage
$240,500
Interest Rate
9.21%
Create a Home Valuation Report for This Property
The Home Valuation Report is an in-depth analysis detailing your home's value as well as a comparison with similar homes in the area
Home Values in the Area
Average Home Value in this Area
Purchase History
| Date | Buyer | Sale Price | Title Company |
|---|---|---|---|
| Mcmaster Ii Donald R | -- | -- | |
| Mcmaster Donald R | -- | -- | |
| Mcmaster Ii Donald R | $248,000 | Old Republic Title Company | |
| Rodriguez Robert C | $267,500 | First American Title Ins Co |
Source: Public Records
Mortgage History
| Date | Status | Borrower | Loan Amount |
|---|---|---|---|
| Open | Mcmaster Ii Donald R | $223,200 | |
| Previous Owner | Rodriguez Robert C | $240,500 |
Source: Public Records
Tax History Compared to Growth
Tax History
| Year | Tax Paid | Tax Assessment Tax Assessment Total Assessment is a certain percentage of the fair market value that is determined by local assessors to be the total taxable value of land and additions on the property. | Land | Improvement |
|---|---|---|---|---|
| 2025 | $5,694 | $485,561 | $161,552 | $324,009 |
| 2024 | $5,694 | $476,041 | $158,385 | $317,656 |
| 2023 | $5,519 | $466,707 | $155,279 | $311,428 |
| 2022 | $5,411 | $457,556 | $152,234 | $305,322 |
| 2021 | $5,306 | $448,585 | $149,249 | $299,336 |
| 2020 | $4,879 | $443,986 | $147,719 | $296,267 |
| 2019 | $4,749 | $435,281 | $144,823 | $290,458 |
| 2018 | $4,651 | $426,747 | $141,984 | $284,763 |
| 2017 | $4,558 | $418,380 | $139,200 | $279,180 |
| 2016 | $4,506 | $410,177 | $136,471 | $273,706 |
| 2015 | $4,189 | $381,166 | $134,422 | $246,744 |
| 2014 | $4,127 | $373,701 | $131,790 | $241,911 |
Source: Public Records
Map
Nearby Homes
- 3036 E Adirondack Ct
- 717 N Valley Dr
- 3366 Blue Ridge Ct
- 2802 E Sierra Dr
- 3414 Holly Grove St
- 3388 Holly Grove St
- 2884 Crescent Way
- 107 Fairview Rd
- 2417 E Hillcrest Dr
- 2453 Los Feliz Dr
- 2457 Chiquita Ln
- 661 Lakeview Canyon Rd
- 581 Lakeview Canyon Rd
- 327 Wynn Ct
- 969 Westbend Rd
- 112 Navajo Way Unit 48
- 0 S Skyline Dr Unit V1-32897
- 0 S Skyline Dr Unit PW24235911
- 2426 Pleasant Way Unit E
- 2450 Pleasant Way Unit J
- 3170 Sierra Dr
- 3158 W Sierra Dr
- 3158 Sierra Dr
- 3176 Sierra Dr
- 3165 Sierra Dr
- 3171 Sierra Dr
- 3152 Sierra Dr
- 3159 Sierra Dr
- 3182 Sierra Dr
- 3177 Sierra Dr
- 3153 Sierra Dr
- 3183 Sierra Dr
- 3160 Black Hills Ct
- 3186 Sierra Dr
- 3166 W Black Hills Ct
- 3160 W Black Hills Ct
- 3166 Black Hills Ct
- 3154 Black Hills Ct
- 3172 W Black Hills Ct
- 3147 W Sierra Dr