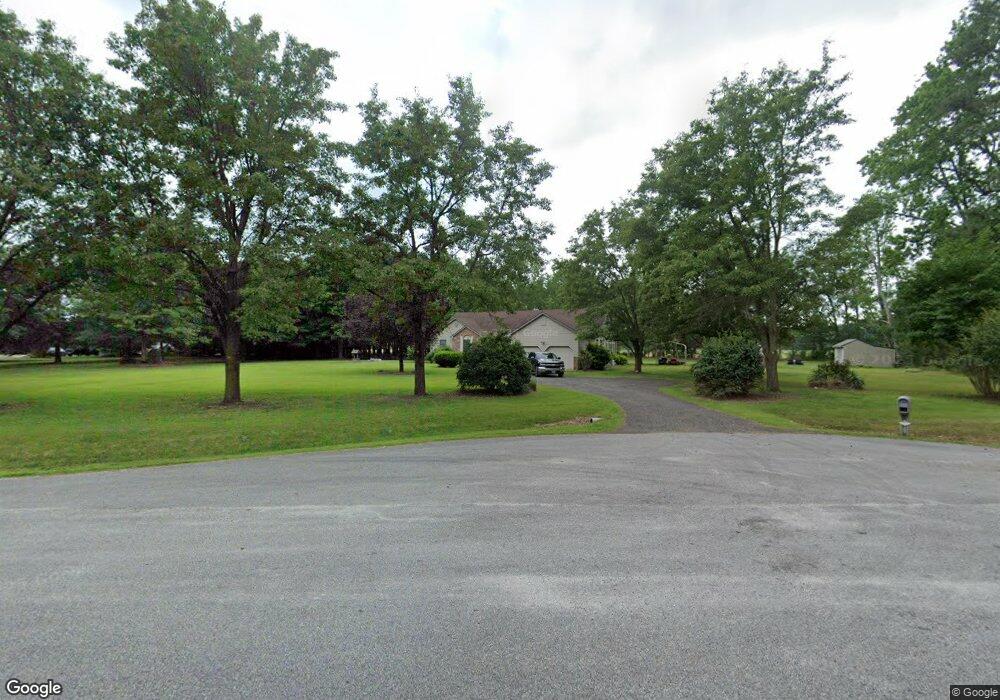
31657 Bishop Dr Cordova, MD 21625
Estimated Value: $477,000 - $556,000
--
Bed
3
Baths
2,105
Sq Ft
$241/Sq Ft
Est. Value
About This Home
This home is located at 31657 Bishop Dr, Cordova, MD 21625 and is currently estimated at $507,055, approximately $240 per square foot. 31657 Bishop Dr is a home located in Talbot County with nearby schools including Chapel District Elementary School, Easton Middle School, and Easton High School.
Ownership History
Date
Name
Owned For
Owner Type
Purchase Details
Closed on
Aug 26, 2024
Sold by
Fetterman William R
Bought by
Gannon James L and Gannon Evelyn A
Current Estimated Value
Home Financials for this Owner
Home Financials are based on the most recent Mortgage that was taken out on this home.
Original Mortgage
$356,250
Outstanding Balance
$352,468
Interest Rate
6.77%
Mortgage Type
New Conventional
Estimated Equity
$154,587
Purchase Details
Closed on
Jul 13, 1995
Sold by
Insley Mace and Insley Adelle
Bought by
Fetterman William R and Fetterman Elizabeth M
Purchase Details
Closed on
Sep 1, 1981
Sold by
Chapel Woods Inc
Bought by
Insley Mace and Insley Adelle
Home Financials for this Owner
Home Financials are based on the most recent Mortgage that was taken out on this home.
Original Mortgage
$10,000
Interest Rate
17.48%
Create a Home Valuation Report for This Property
The Home Valuation Report is an in-depth analysis detailing your home's value as well as a comparison with similar homes in the area
Home Values in the Area
Average Home Value in this Area
Purchase History
| Date | Buyer | Sale Price | Title Company |
|---|---|---|---|
| Gannon James L | $475,000 | None Listed On Document | |
| Gannon James L | $475,000 | None Listed On Document | |
| Fetterman William R | $37,000 | -- | |
| Insley Mace | $12,500 | -- |
Source: Public Records
Mortgage History
| Date | Status | Borrower | Loan Amount |
|---|---|---|---|
| Open | Gannon James L | $356,250 | |
| Closed | Gannon James L | $356,250 | |
| Previous Owner | Insley Mace | $10,000 |
Source: Public Records
Tax History Compared to Growth
Tax History
| Year | Tax Paid | Tax Assessment Tax Assessment Total Assessment is a certain percentage of the fair market value that is determined by local assessors to be the total taxable value of land and additions on the property. | Land | Improvement |
|---|---|---|---|---|
| 2025 | $1,624 | $400,200 | $0 | $0 |
| 2024 | $1,624 | $375,100 | $0 | $0 |
| 2023 | $1,527 | $350,000 | $109,800 | $240,200 |
| 2022 | $1,434 | $346,267 | $0 | $0 |
| 2021 | $1,361 | $342,533 | $0 | $0 |
| 2020 | $1,361 | $338,800 | $112,100 | $226,700 |
| 2019 | $1,350 | $328,967 | $0 | $0 |
| 2018 | $1,303 | $319,133 | $0 | $0 |
| 2017 | $1,240 | $309,300 | $0 | $0 |
| 2016 | $1,181 | $309,167 | $0 | $0 |
| 2015 | $1,076 | $309,033 | $0 | $0 |
| 2014 | $1,076 | $308,900 | $0 | $0 |
Source: Public Records
Map
Nearby Homes
- 11482 Kittys Corner Rd
- 31127 Willis St
- 0 Cordova Rd Unit MDTA2011672
- 10640 Kittys Corner Rd
- 31570 Miller Rd
- 0 Skipton Cordova Rd
- Lot A Blades Rd
- Lot B Blades Rd
- 0 Quail Ct Unit MDCM2006644
- 10380 Chapel Rd
- 13404 Cannery Rd
- 13508 Main St
- 13510 Main St
- 13500 1st St
- 21948 Main St
- 22005 Main St
- 33293 Matthewstown Rd
- 22060 Main St
- 29597 Skipton Estates Dr
- 8578 Tuckahoe Rd
- 31673 Bishop Dr
- 31639 Bishop Dr
- 31672 Bishop Dr
- 31705 Bishop Dr
- 31691 Bishop Dr
- 31717 Bishop Dr
- 31719 Bishop Dr
- 11580 Malvern Ln
- 31740 Bishop Dr
- 11598 Malvern Ln
- 11589 Malvern Ln
- 31755 Bishop Dr
- 31749 Bishop Dr
- 11601 Malvern Ln
- 11634 Malvern Ln
- 31770 Bishop Dr
- 11613 Malvern Ln
- 31771 Bishop Dr
- 11536 Chapel Rd
- 11338 Chapel Rd