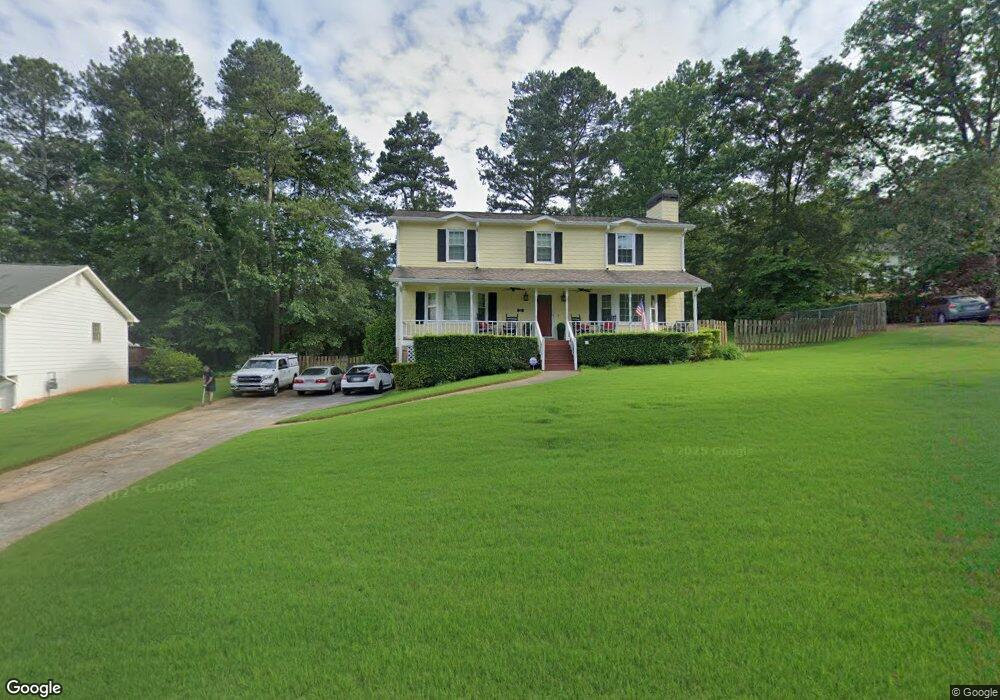
3166 Bouchard Way NE Unit 2 Marietta, GA 30066
Sandy Plains NeighborhoodEstimated Value: $453,000 - $612,000
4
Beds
3
Baths
2,788
Sq Ft
$187/Sq Ft
Est. Value
About This Home
This home is located at 3166 Bouchard Way NE Unit 2, Marietta, GA 30066 and is currently estimated at $519,984, approximately $186 per square foot. 3166 Bouchard Way NE Unit 2 is a home located in Cobb County with nearby schools including Rocky Mount Elementary School, Mabry Middle School, and Lassiter High School.
Ownership History
Date
Name
Owned For
Owner Type
Purchase Details
Closed on
Apr 16, 2007
Sold by
Johnson Jeffrey M and Johnson Deborah K
Bought by
Stell Christopher P and Stell Elizabeth M
Current Estimated Value
Home Financials for this Owner
Home Financials are based on the most recent Mortgage that was taken out on this home.
Original Mortgage
$224,675
Interest Rate
6.1%
Mortgage Type
New Conventional
Purchase Details
Closed on
Jan 18, 1994
Sold by
Silva David W Lana A
Bought by
Johnson Jeffrey M
Home Financials for this Owner
Home Financials are based on the most recent Mortgage that was taken out on this home.
Original Mortgage
$111,600
Interest Rate
7.1%
Create a Home Valuation Report for This Property
The Home Valuation Report is an in-depth analysis detailing your home's value as well as a comparison with similar homes in the area
Home Values in the Area
Average Home Value in this Area
Purchase History
| Date | Buyer | Sale Price | Title Company |
|---|---|---|---|
| Stell Christopher P | -- | -- | |
| Stell Christopher P | $236,500 | -- | |
| Johnson Jeffrey M | $117,500 | -- |
Source: Public Records
Mortgage History
| Date | Status | Borrower | Loan Amount |
|---|---|---|---|
| Previous Owner | Stell Christopher P | $224,675 | |
| Previous Owner | Johnson Jeffrey M | $111,600 |
Source: Public Records
Tax History Compared to Growth
Tax History
| Year | Tax Paid | Tax Assessment Tax Assessment Total Assessment is a certain percentage of the fair market value that is determined by local assessors to be the total taxable value of land and additions on the property. | Land | Improvement |
|---|---|---|---|---|
| 2025 | $4,796 | $200,772 | $40,000 | $160,772 |
| 2024 | $4,800 | $200,772 | $40,000 | $160,772 |
| 2023 | $3,105 | $147,680 | $30,000 | $117,680 |
| 2022 | $3,676 | $147,680 | $30,000 | $117,680 |
| 2021 | $3,149 | $123,624 | $26,000 | $97,624 |
| 2020 | $3,149 | $123,624 | $26,000 | $97,624 |
| 2019 | $3,042 | $118,752 | $18,000 | $100,752 |
| 2018 | $3,042 | $118,752 | $18,000 | $100,752 |
| 2017 | $2,486 | $98,704 | $18,000 | $80,704 |
| 2016 | $2,489 | $98,704 | $18,000 | $80,704 |
| 2015 | $2,248 | $85,308 | $18,000 | $67,308 |
| 2014 | $2,268 | $85,308 | $0 | $0 |
Source: Public Records
Map
Nearby Homes
- 3333 Devaughn Dr NE
- 3350 Brookhill Cir
- 3130 Maley Ct
- 4397 Windsor Oaks Cir
- 4302 Highborne Dr NE Unit 3
- 4219 N Mountain Rd NE
- 3043 Sawyer Trace NE
- 3851 Timber Hollow Way
- 3238 Mountain Hollow Dr
- 3147 Swallow Dr NE
- 4563 Ashmore Cir NE
- 3798 Upland Dr
- 4259 Arbor Club Dr
- 4243 N Mountain Rd NE
- 3480 Pebble Hill Dr
- 2855 Lamer Trace
- 2713 Arbor Summit
- 2696 S Arbor Dr
- 4464 Windsor Oaks Dr
- 3164 Bouchard Way NE
- 3168 Bouchard Way NE
- 0 Bouchard Way NE
- 3271 Devaughn Dr NE
- 3279 Devaughn Dr NE
- 3261 Devaughn Dr NE
- 3165 Bouchard Way NE
- 3285 Devaughn Dr NE
- 3170 Bouchard Way NE Unit 2
- 3163 Bouchard Way NE Unit 2
- 3175 Bouchard Way NE
- 3162 Bouchard Way NE
- 3293 Devaughn Dr NE
- 3255 Devaughn Dr NE
- 3319 Devaughn Dr NE
- 3282 Devaughn Dr NE
- 3159 Bouchard Way NE
- 3272 Devaughn Dr NE
- 3160 Bouchard Way NE
- 3256 Devaughn Dr NE