Estimated Value: $440,000 - $499,429
3
Beds
1
Bath
1,886
Sq Ft
$245/Sq Ft
Est. Value
About This Home
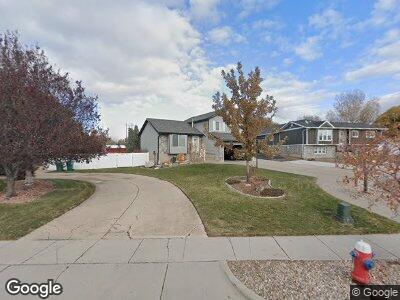
This home is located at 3166 W 5700 S, Roy, UT 84067 and is currently estimated at $462,857, approximately $245 per square foot. 3166 W 5700 S is a home located in Weber County with nearby schools including Roy Elementary School, Roy Junior High School, and Roy High School.
Ownership History
Date
Name
Owned For
Owner Type
Purchase Details
Closed on
Jan 12, 2009
Sold by
Davis Darin
Bought by
Wergin Casey R and Wergin Kristy A
Current Estimated Value
Home Financials for this Owner
Home Financials are based on the most recent Mortgage that was taken out on this home.
Original Mortgage
$6,630
Interest Rate
5.04%
Mortgage Type
Stand Alone Second
Purchase Details
Closed on
Sep 18, 2006
Sold by
Scovel Robyn G
Bought by
Davis Darin
Home Financials for this Owner
Home Financials are based on the most recent Mortgage that was taken out on this home.
Original Mortgage
$145,350
Interest Rate
7.25%
Mortgage Type
Unknown
Purchase Details
Closed on
May 5, 2006
Sold by
Scovel Douglas L
Bought by
Scovel Robyn G
Purchase Details
Closed on
Apr 10, 2001
Sold by
Scovel Douglas L and Scovel Robyn G
Bought by
Scovel Douglas L and Scovel Robyn G
Create a Home Valuation Report for This Property
The Home Valuation Report is an in-depth analysis detailing your home's value as well as a comparison with similar homes in the area
Home Values in the Area
Average Home Value in this Area
Purchase History
| Date | Buyer | Sale Price | Title Company |
|---|---|---|---|
| Wergin Casey R | -- | First American Fashion Point | |
| Davis Darin | -- | Pinnacle Title | |
| Scovel Robyn G | -- | Pinnacle Title Insurance Age | |
| Scovel Douglas L | -- | First American Title |
Source: Public Records
Mortgage History
| Date | Status | Borrower | Loan Amount |
|---|---|---|---|
| Open | Wergin Casey R | $10,000 | |
| Open | Wergin Casey R | $204,500 | |
| Closed | Wergin Casey R | $50,000 | |
| Closed | Wergin Casey R | $162,000 | |
| Closed | Wergin Casey R | $6,630 | |
| Closed | Wergin Casey R | $159,262 | |
| Previous Owner | Davis Darin | $145,350 | |
| Previous Owner | Davis Darin | $36,300 |
Source: Public Records
Tax History Compared to Growth
Tax History
| Year | Tax Paid | Tax Assessment Tax Assessment Total Assessment is a certain percentage of the fair market value that is determined by local assessors to be the total taxable value of land and additions on the property. | Land | Improvement |
|---|---|---|---|---|
| 2024 | $2,849 | $242,047 | $85,188 | $156,859 |
| 2023 | $2,664 | $225,528 | $84,380 | $141,148 |
| 2022 | $2,661 | $229,351 | $62,244 | $167,107 |
| 2021 | $2,440 | $349,000 | $87,373 | $261,627 |
| 2020 | $2,237 | $293,999 | $87,373 | $206,626 |
| 2019 | $2,164 | $269,000 | $56,756 | $212,244 |
| 2018 | $1,910 | $222,000 | $51,614 | $170,386 |
| 2017 | $1,777 | $193,922 | $51,614 | $142,308 |
| 2016 | $1,620 | $94,625 | $22,908 | $71,717 |
| 2015 | $1,413 | $83,669 | $22,908 | $60,761 |
| 2014 | $1,325 | $77,144 | $22,908 | $54,236 |
Source: Public Records
Map
Nearby Homes
- 3166 W 5700 S
- 3157 W 5700 S
- 3154 W 5700 S
- 3178 W 5700 S
- 3175 W 5700 S Unit LOT 4
- 3173 W 5700 S Unit 5
- 3165 W 5700 S
- 3177 W 5700 S
- 3177 W 5700 S
- 3177 W 5700 S Unit .35
- 3194 W 5825 S
- 3198 W 5825 S
- 5823 S 3200 W
- 3188 W 5825 S
- 5757 S 3100 W
- 5692 S 3200 W
- 5691 S 3200 W
- 5691 S 3200 W Unit 24
- 5693 S 3150 W
- 3158 W 5825 S