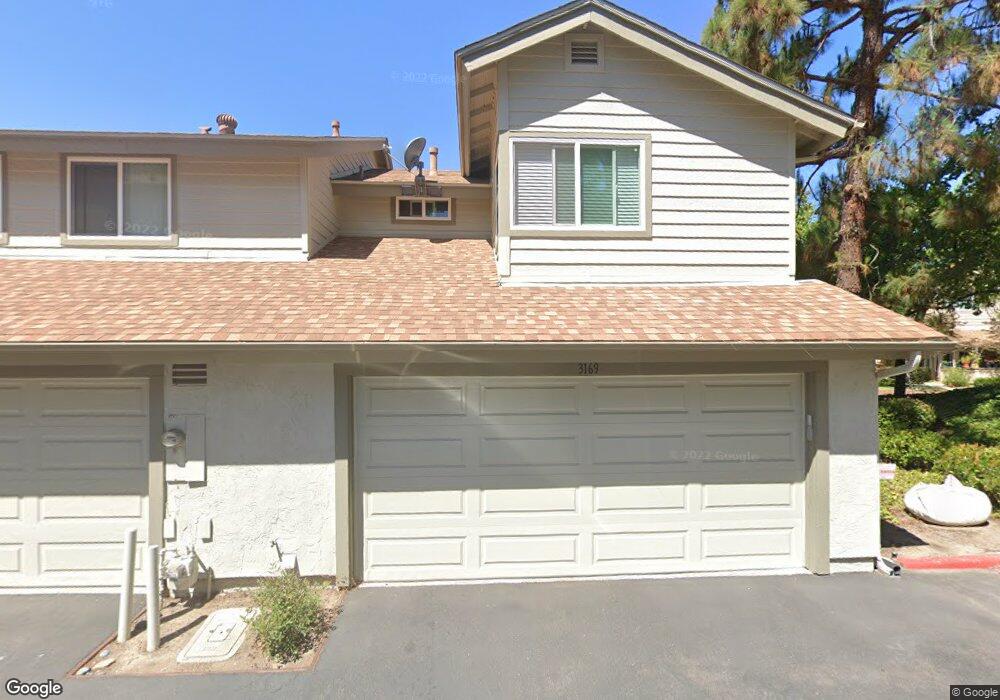
3169 Old Bridgeport Way San Diego, CA 92111
Clairemont Mesa West NeighborhoodEstimated Value: $812,495 - $889,000
2
Beds
3
Baths
1,468
Sq Ft
$586/Sq Ft
Est. Value
About This Home
This home is located at 3169 Old Bridgeport Way, San Diego, CA 92111 and is currently estimated at $860,874, approximately $586 per square foot. 3169 Old Bridgeport Way is a home located in San Diego County with nearby schools including Holmes Elementary, Marston Middle School, and Clairemont High School.
Ownership History
Date
Name
Owned For
Owner Type
Purchase Details
Closed on
Mar 17, 2012
Sold by
Wilkinson Robert O and Herzog Catherine M
Bought by
Wilkinson Robert O and Herzog Catherine M
Current Estimated Value
Purchase Details
Closed on
Oct 24, 2011
Sold by
Wilkinson Robert Owen
Bought by
Wilkinson Robert Owen
Home Financials for this Owner
Home Financials are based on the most recent Mortgage that was taken out on this home.
Original Mortgage
$228,500
Outstanding Balance
$154,107
Interest Rate
3.87%
Mortgage Type
New Conventional
Estimated Equity
$706,767
Purchase Details
Closed on
Oct 10, 2011
Sold by
Wilkinson Robert Owen
Bought by
Wilkinson Robert O and Herzog Catherine M
Home Financials for this Owner
Home Financials are based on the most recent Mortgage that was taken out on this home.
Original Mortgage
$228,500
Outstanding Balance
$154,107
Interest Rate
3.87%
Mortgage Type
New Conventional
Estimated Equity
$706,767
Purchase Details
Closed on
Jan 26, 2010
Sold by
Wilkinson Robert Owen
Bought by
Wilkinson Robert O
Purchase Details
Closed on
Aug 24, 2009
Sold by
Wilkinson Robert Owen
Bought by
Wilkinson Robert Owen
Purchase Details
Closed on
Jun 1, 2007
Sold by
Wilkinson Robert Owen
Bought by
Wilkinson Robert O
Purchase Details
Closed on
Dec 16, 2000
Sold by
Herzog Catherine Marie
Bought by
Wilkinson Robert Owen
Home Financials for this Owner
Home Financials are based on the most recent Mortgage that was taken out on this home.
Original Mortgage
$179,000
Interest Rate
7.71%
Mortgage Type
Purchase Money Mortgage
Purchase Details
Closed on
Jul 17, 1996
Sold by
Smith Michael J
Bought by
Wilkinson Robert Owen
Home Financials for this Owner
Home Financials are based on the most recent Mortgage that was taken out on this home.
Original Mortgage
$151,622
Interest Rate
8.33%
Mortgage Type
FHA
Purchase Details
Closed on
May 12, 1995
Sold by
Smith Rita
Bought by
Smith Michael J
Home Financials for this Owner
Home Financials are based on the most recent Mortgage that was taken out on this home.
Original Mortgage
$154,350
Interest Rate
7.92%
Purchase Details
Closed on
May 8, 1995
Sold by
Rice Thomas B
Bought by
Smith Michael J
Home Financials for this Owner
Home Financials are based on the most recent Mortgage that was taken out on this home.
Original Mortgage
$154,350
Interest Rate
7.92%
Purchase Details
Closed on
Oct 24, 1986
Purchase Details
Closed on
Aug 18, 1983
Create a Home Valuation Report for This Property
The Home Valuation Report is an in-depth analysis detailing your home's value as well as a comparison with similar homes in the area
Home Values in the Area
Average Home Value in this Area
Purchase History
| Date | Buyer | Sale Price | Title Company |
|---|---|---|---|
| Wilkinson Robert O | -- | None Available | |
| Wilkinson Robert O | -- | None Available | |
| Wilkinson Robert Owen | -- | None Available | |
| Wilkinson Robert O | -- | First American Title Company | |
| Wilkinson Robert O | -- | None Available | |
| Wilkinson Robert Owen | -- | None Available | |
| Wilkinson Robert O | -- | None Available | |
| Wilkinson Robert Owen | -- | Southland Title Corporation | |
| Wilkinson Robert Owen | -- | Southland Title Corporation | |
| Wilkinson Robert Owen | $155,000 | Chicago Title Co | |
| Smith Michael J | -- | Guardian Title Company | |
| Smith Michael J | $162,500 | Guardian Title Company | |
| -- | $127,000 | -- | |
| -- | $104,000 | -- |
Source: Public Records
Mortgage History
| Date | Status | Borrower | Loan Amount |
|---|---|---|---|
| Open | Wilkinson Robert O | $228,500 | |
| Closed | Wilkinson Robert Owen | $179,000 | |
| Closed | Wilkinson Robert Owen | $151,622 | |
| Previous Owner | Smith Michael J | $154,350 |
Source: Public Records
Tax History Compared to Growth
Tax History
| Year | Tax Paid | Tax Assessment Tax Assessment Total Assessment is a certain percentage of the fair market value that is determined by local assessors to be the total taxable value of land and additions on the property. | Land | Improvement |
|---|---|---|---|---|
| 2025 | $2,985 | $252,415 | $109,961 | $142,454 |
| 2024 | $2,985 | $247,466 | $107,805 | $139,661 |
| 2023 | $2,917 | $242,615 | $105,692 | $136,923 |
| 2022 | $2,838 | $237,859 | $103,620 | $134,239 |
| 2021 | $2,818 | $233,196 | $101,589 | $131,607 |
| 2020 | $2,783 | $230,806 | $100,548 | $130,258 |
| 2019 | $2,732 | $226,281 | $98,577 | $127,704 |
| 2018 | $2,554 | $221,845 | $96,645 | $125,200 |
| 2017 | $80 | $217,496 | $94,750 | $122,746 |
| 2016 | $2,450 | $213,233 | $92,893 | $120,340 |
| 2015 | $2,413 | $210,031 | $91,498 | $118,533 |
| 2014 | $2,374 | $205,918 | $89,706 | $116,212 |
Source: Public Records
Map
Nearby Homes
- 3120 Old Bridgeport Way
- 3047 Old Bridgeport Way
- 3218 Old Bridgeport Way
- 3014 Old Bridgeport Way
- 3226 Old Heather Rd
- 3298 Old Heather Rd
- 3710 Old Cobble Rd
- 3270 W Fox Run Way Unit 2
- 3405 Aveley Place
- 3413 Rollsreach Dr
- 3516 Old Cobble Rd
- 5581 Mount Acara Dr
- 3262 Mount Carol Dr
- 3581 Mount Abbey Ave
- 3161 Mount Tami Dr
- 6929 Park Mesa Way Unit 126
- 7045 Beagle St
- 3173 Via Arcilla
- 7016 Park Mesa Way
- 7029 Hilton Place
- 3167 Old Bridgeport Way
- 3165 Old Bridgeport Way
- 3163 Old Bridgeport Way
- 3183 Old Bridgeport Way
- 3161 Old Bridgeport Way
- 3157 Old Bridgeport Way
- 3181 Old Bridgeport Way
- 3155 Old Bridgeport Way
- 3257 Old Bridgeport Way
- 3153 Old Bridgeport Way
- 3229 Old Bridgeport Way
- 3179 Old Bridgeport Way
- 3177 Old Bridgeport Way
- 3151 Old Bridgeport Way
- 3231 Old Bridgeport Way Unit 3
- 3259 Old Bridgeport Way
- 3159 Old Bridgeport Way
- 3175 Old Bridgeport Way
- 3233 Old Bridgeport Way
- 3149 Old Bridgeport Way