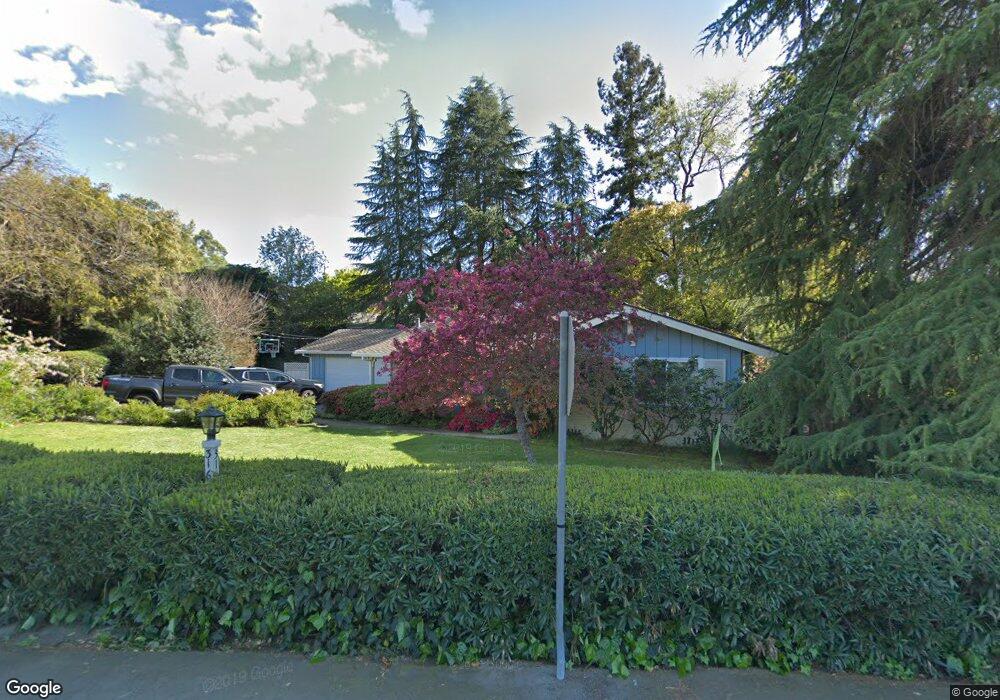
3169 Old Tunnel Rd Lafayette, CA 94549
Peardale Estates NeighborhoodEstimated Value: $1,143,000 - $1,589,000
3
Beds
2
Baths
1,462
Sq Ft
$919/Sq Ft
Est. Value
About This Home
This home is located at 3169 Old Tunnel Rd, Lafayette, CA 94549 and is currently estimated at $1,343,451, approximately $918 per square foot. 3169 Old Tunnel Rd is a home located in Contra Costa County with nearby schools including Burton Valley Elementary School, M.H. Stanley Middle School, and Acalanes High School.
Ownership History
Date
Name
Owned For
Owner Type
Purchase Details
Closed on
Aug 7, 2014
Sold by
Beaver Christopher Scott and Beaver Erin Lynn
Bought by
Beaver Christopher S and Beaver Erin L
Current Estimated Value
Home Financials for this Owner
Home Financials are based on the most recent Mortgage that was taken out on this home.
Original Mortgage
$330,000
Outstanding Balance
$251,624
Interest Rate
4.11%
Mortgage Type
New Conventional
Estimated Equity
$1,091,827
Purchase Details
Closed on
Mar 23, 2012
Sold by
Owens Tracy
Bought by
Beaver Christopher Scott and Beaver Erin Lynn
Home Financials for this Owner
Home Financials are based on the most recent Mortgage that was taken out on this home.
Original Mortgage
$310,000
Interest Rate
3.83%
Mortgage Type
New Conventional
Purchase Details
Closed on
Dec 21, 2010
Sold by
Ling Julia G
Bought by
Ling Julia G
Create a Home Valuation Report for This Property
The Home Valuation Report is an in-depth analysis detailing your home's value as well as a comparison with similar homes in the area
Home Values in the Area
Average Home Value in this Area
Purchase History
| Date | Buyer | Sale Price | Title Company |
|---|---|---|---|
| Beaver Christopher S | -- | Chicago Title Company | |
| Beaver Christopher Scott | $595,000 | Chicago Title Company | |
| Ling Julia G | -- | None Available |
Source: Public Records
Mortgage History
| Date | Status | Borrower | Loan Amount |
|---|---|---|---|
| Open | Beaver Christopher S | $330,000 | |
| Closed | Beaver Christopher Scott | $310,000 |
Source: Public Records
Tax History
| Year | Tax Paid | Tax Assessment Tax Assessment Total Assessment is a certain percentage of the fair market value that is determined by local assessors to be the total taxable value of land and additions on the property. | Land | Improvement |
|---|---|---|---|---|
| 2025 | $10,180 | $747,341 | $670,100 | $77,241 |
| 2024 | $10,003 | $732,688 | $656,961 | $75,727 |
| 2023 | $9,817 | $718,323 | $644,080 | $74,243 |
| 2022 | $9,664 | $704,239 | $631,451 | $72,788 |
| 2021 | $9,385 | $690,431 | $619,070 | $71,361 |
| 2019 | $8,988 | $669,955 | $600,709 | $69,246 |
| 2018 | $8,674 | $656,820 | $588,931 | $67,889 |
| 2017 | $8,526 | $643,942 | $577,384 | $66,558 |
| 2016 | $8,350 | $631,316 | $566,063 | $65,253 |
| 2015 | $8,119 | $621,834 | $557,561 | $64,273 |
| 2014 | $8,030 | $609,654 | $546,640 | $63,014 |
Source: Public Records
Map
Nearby Homes
- 3279 Mt Diablo Ct Unit 20
- 3279 Mt Diablo Ct Unit 13
- 1015 Regio Ct
- 1521 Sunset Loop
- 0 Gladys Ct
- 1315 El Curtola Blvd
- 1356 El Curtola Blvd
- 70 Carolyn Ct
- 942 Raintree Place
- 3268 Marlene Dr Unit 12
- 12 Westminster Place
- 1160 Dunsyre Dr
- 194 Hillcroft Way
- 959 Janet Ln
- 940 Reliez Station Ln
- 1210 Kendall Ct
- 130 Hillcroft Way
- 3161 Plymouth Rd
- 2513 Lucy Ln Unit B
- 43 Cuesta Way
- 1039 Windsor Dr
- 1064 Manzana Place
- 1056 Manzana Place
- 3162 Old Tunnel Rd
- 3167 Old Tunnel Rd
- 3164 Maryola Ct
- 1037 Windsor Dr
- 3156 Old Tunnel Rd
- 1058 Viela Ct
- 1050 Manzana Place
- 3175 Old Tunnel Rd
- 1048 Manzana Place
- 3158 Maryola Ct
- 3161 Old Tunnel Rd
- 3165 Maryola Ct
- 1055 Manzana Place
- 1035 Windsor Dr
- 3160 Old Tunnel Rd
- 1057 Viela Ct
- 3146 Old Tunnel Rd
Your Personal Tour Guide
Ask me questions while you tour the home.