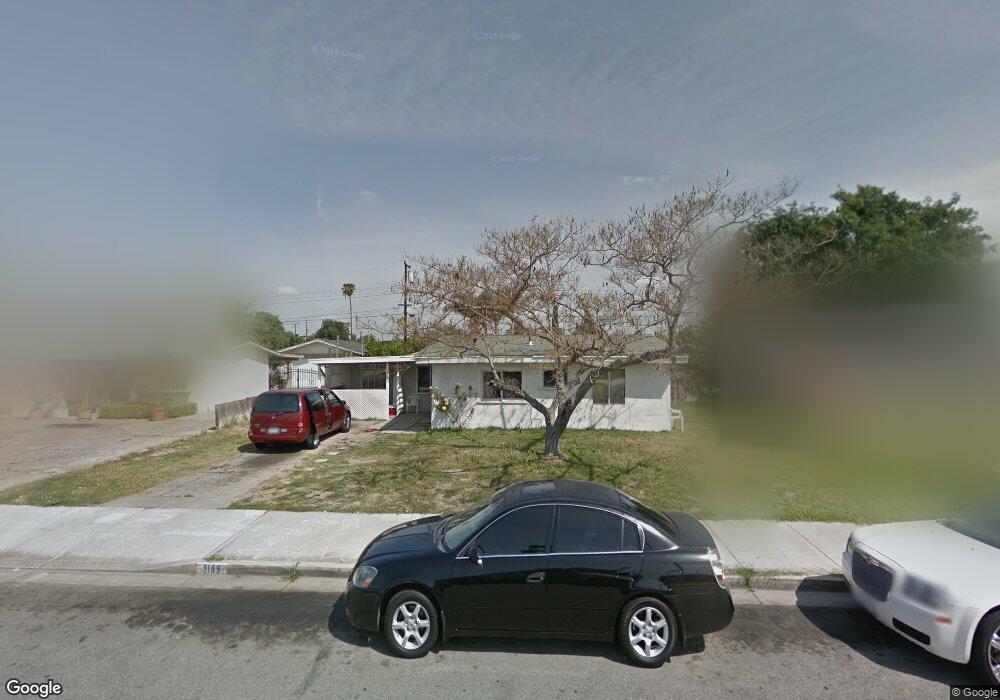
3169 W Tyler Ave Anaheim, CA 92801
Northwest Anaheim NeighborhoodEstimated Value: $654,000 - $817,000
3
Beds
1
Bath
984
Sq Ft
$753/Sq Ft
Est. Value
About This Home
This home is located at 3169 W Tyler Ave, Anaheim, CA 92801 and is currently estimated at $740,977, approximately $753 per square foot. 3169 W Tyler Ave is a home located in Orange County with nearby schools including Centralia Elementary School, Orangeview Junior High, and Western High School.
Ownership History
Date
Name
Owned For
Owner Type
Purchase Details
Closed on
Apr 8, 2005
Sold by
Campos William and Macias Diana M
Bought by
Macias Jesse and Macias Diana M
Current Estimated Value
Home Financials for this Owner
Home Financials are based on the most recent Mortgage that was taken out on this home.
Original Mortgage
$285,000
Outstanding Balance
$221,973
Interest Rate
6.55%
Mortgage Type
Purchase Money Mortgage
Estimated Equity
$519,004
Purchase Details
Closed on
Feb 16, 2000
Sold by
Phillip Campos Richard
Bought by
Marie Diana Macias and Macias Jesse Aranda
Purchase Details
Closed on
Nov 21, 1997
Sold by
Philip Campos Richard
Bought by
Campos Richard Philip and Campos William
Home Financials for this Owner
Home Financials are based on the most recent Mortgage that was taken out on this home.
Original Mortgage
$15,000
Interest Rate
3.95%
Purchase Details
Closed on
Jun 30, 1994
Sold by
Campos Sarah M
Bought by
Campos Richard Philip
Create a Home Valuation Report for This Property
The Home Valuation Report is an in-depth analysis detailing your home's value as well as a comparison with similar homes in the area
Home Values in the Area
Average Home Value in this Area
Purchase History
| Date | Buyer | Sale Price | Title Company |
|---|---|---|---|
| Macias Jesse | -- | Ticor Title Company Of Ca | |
| Marie Diana Macias | -- | -- | |
| Campos Richard Philip | -- | Southland Title Corporation | |
| Campos Richard Philip | -- | -- |
Source: Public Records
Mortgage History
| Date | Status | Borrower | Loan Amount |
|---|---|---|---|
| Open | Macias Jesse | $285,000 | |
| Closed | Campos Richard Philip | $15,000 |
Source: Public Records
Tax History Compared to Growth
Tax History
| Year | Tax Paid | Tax Assessment Tax Assessment Total Assessment is a certain percentage of the fair market value that is determined by local assessors to be the total taxable value of land and additions on the property. | Land | Improvement |
|---|---|---|---|---|
| 2025 | $4,708 | $405,017 | $355,910 | $49,107 |
| 2024 | $4,708 | $397,076 | $348,931 | $48,145 |
| 2023 | $4,590 | $389,291 | $342,090 | $47,201 |
| 2022 | $4,530 | $381,658 | $335,382 | $46,276 |
| 2021 | $4,465 | $374,175 | $328,806 | $45,369 |
| 2020 | $4,438 | $370,339 | $325,435 | $44,904 |
| 2019 | $4,327 | $363,078 | $319,054 | $44,024 |
| 2018 | $4,248 | $355,959 | $312,798 | $43,161 |
| 2017 | $4,115 | $348,980 | $306,665 | $42,315 |
| 2016 | $4,036 | $342,138 | $300,652 | $41,486 |
| 2015 | $3,996 | $336,999 | $296,136 | $40,863 |
| 2014 | $3,792 | $330,000 | $290,335 | $39,665 |
Source: Public Records
Map
Nearby Homes
- 3131 W Polk Ave
- 7545 Jackson Way
- 3238 W Cabot Dr
- 3053 W Coolidge Ave
- 7950 Jackson Way
- 7173 Monroe Ave
- 211 S Beach Blvd Unit 92
- 235 S Beach Blvd Unit 132
- 109 S Laxore St
- Plan Two at Mason
- Plan Four at Mason
- Plan Three at Mason
- Plan Seven at Mason
- 103 S Laxore St
- 106 S Laxore St Unit 407
- 107 S Laxore St
- 6741 W Lincoln Ave Unit 32
- 3402 W Danbrook Ave
- 231 S Laxore St
- 2942 W Floyd Ave
- 3165 W Tyler Ave
- 3173 W Tyler Ave
- 3168 W Monroe Ave
- 3177 W Tyler Ave
- 3161 W Tyler Ave
- 3172 W Monroe Ave
- 3164 W Monroe Ave
- 3168 W Tyler Ave
- 3176 W Monroe Ave
- 3160 W Monroe Ave
- 3164 W Tyler Ave
- 3155 W Tyler Ave
- 3181 W Tyler Ave
- 3176 W Tyler Ave
- 3160 W Tyler Ave
- 3154 W Monroe Ave
- 3180 W Monroe Ave
- 3151 W Tyler Ave
- 3154 W Tyler Ave
- 3180 W Tyler Ave