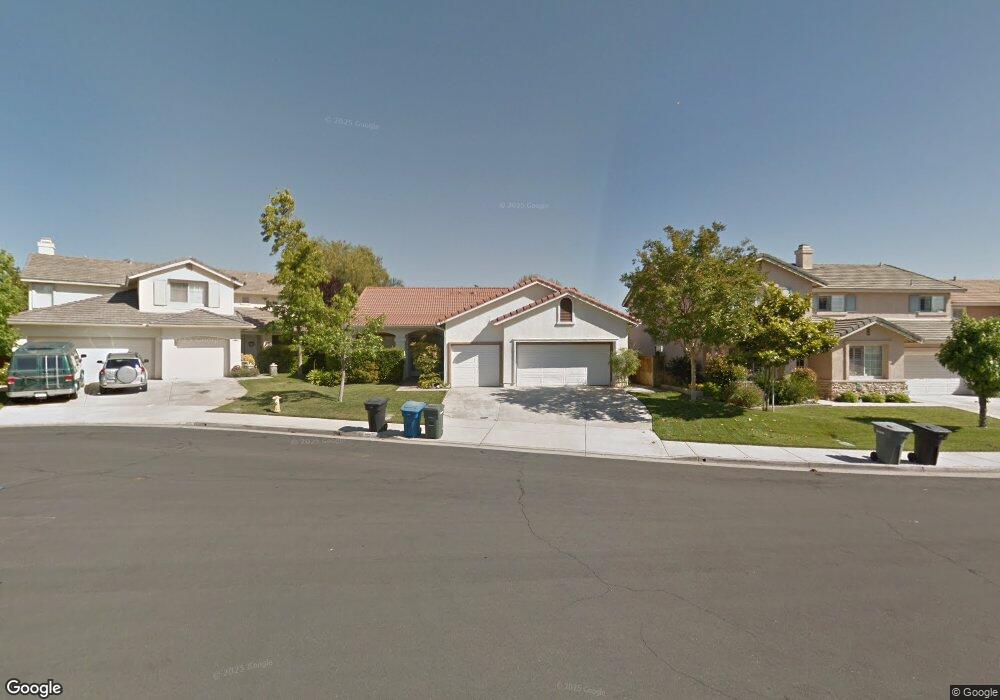
31693 Weibel Cir Temecula, CA 92591
Chardonnay Hills NeighborhoodEstimated Value: $728,963 - $781,000
4
Beds
3
Baths
2,284
Sq Ft
$330/Sq Ft
Est. Value
About This Home
This home is located at 31693 Weibel Cir, Temecula, CA 92591 and is currently estimated at $752,741, approximately $329 per square foot. 31693 Weibel Cir is a home located in Riverside County with nearby schools including Rancho Elementary School, Margarita Middle School, and Temecula Valley High School.
Ownership History
Date
Name
Owned For
Owner Type
Purchase Details
Closed on
Jul 11, 2024
Sold by
Duncan Charles and Duncan Natalia
Bought by
Charles & Natalia Duncan Family Trust
Current Estimated Value
Purchase Details
Closed on
Mar 13, 2000
Sold by
Duncan Charles L
Bought by
Duncan Charles L and Duncan Natalia
Purchase Details
Closed on
Jun 10, 1999
Sold by
Lennar Homes Of California Inc
Bought by
Duncan Charles L
Home Financials for this Owner
Home Financials are based on the most recent Mortgage that was taken out on this home.
Original Mortgage
$50,000
Interest Rate
5.62%
Create a Home Valuation Report for This Property
The Home Valuation Report is an in-depth analysis detailing your home's value as well as a comparison with similar homes in the area
Home Values in the Area
Average Home Value in this Area
Purchase History
| Date | Buyer | Sale Price | Title Company |
|---|---|---|---|
| Charles & Natalia Duncan Family Trust | -- | None Listed On Document | |
| Duncan Charles L | -- | -- | |
| Duncan Charles L | $205,000 | First American Title Co |
Source: Public Records
Mortgage History
| Date | Status | Borrower | Loan Amount |
|---|---|---|---|
| Previous Owner | Duncan Charles L | $50,000 |
Source: Public Records
Tax History
| Year | Tax Paid | Tax Assessment Tax Assessment Total Assessment is a certain percentage of the fair market value that is determined by local assessors to be the total taxable value of land and additions on the property. | Land | Improvement |
|---|---|---|---|---|
| 2025 | $3,862 | $321,347 | $70,531 | $250,816 |
| 2023 | $3,862 | $308,872 | $67,794 | $241,078 |
| 2022 | $3,735 | $302,816 | $66,465 | $236,351 |
| 2021 | $3,652 | $296,879 | $65,162 | $231,717 |
| 2020 | $3,609 | $293,836 | $64,494 | $229,342 |
| 2019 | $3,554 | $288,076 | $63,230 | $224,846 |
| 2018 | $3,480 | $282,429 | $61,992 | $220,437 |
| 2017 | $3,414 | $276,892 | $60,777 | $216,115 |
| 2016 | $3,348 | $271,464 | $59,586 | $211,878 |
| 2015 | $3,287 | $267,389 | $58,692 | $208,697 |
| 2014 | $3,184 | $262,154 | $57,544 | $204,610 |
Source: Public Records
Map
Nearby Homes
- 40973 Cebu Dr
- 0 Winchester Rd Unit IG26012987
- 0 Vista Del Monte Rd Unit SW24075540
- 41087 Promenade Chardonnay Hills
- 31457 Britton Cir
- 32202 Placer Belair
- 32130 Fiesta Ranch Rd S
- 32191 Placer Belair
- 40601 Cebu St
- 41574 Eagle Point Way
- 32249 Chemin Laurent
- 31461 Congressional Dr
- 41309 Avenida Biona
- 41606 Slice Way
- 31345 Avenida Del Reposo
- 31465 Inverness Ct
- 31903 Vineyard Ave
- 40579 New Town Dr
- 40493 Calle Katerine
- 31874 Camino Marea
- 31685 Weibel Cir
- 31705 Weibel Cir
- 31675 Weibel Cir
- 31715 Weibel Cir
- 31720 Weibel Cir
- 31665 Weibel Cir
- 31696 Weibel Cir
- 31686 Weibel Cir
- 31676 Weibel Cir
- 31706 Weibel Cir
- 31664 Weibel Cir
- 40969 Julo Way
- 40959 Julo Way
- 31695 Ahern Place
- 31683 Ahern Place
- 31645 Promenade Bordeaux
- 31637 Promenade Bordeaux
- 31707 Ahern Place
- 31671 Ahern Place
- 31661 Ahern Place
Your Personal Tour Guide
Ask me questions while you tour the home.