317 225th St SW Bothell, WA 98021
Queensborough-Brentwood NeighborhoodEstimated Value: $714,000 - $820,000
2
Beds
1
Bath
1,192
Sq Ft
$637/Sq Ft
Est. Value
About This Home
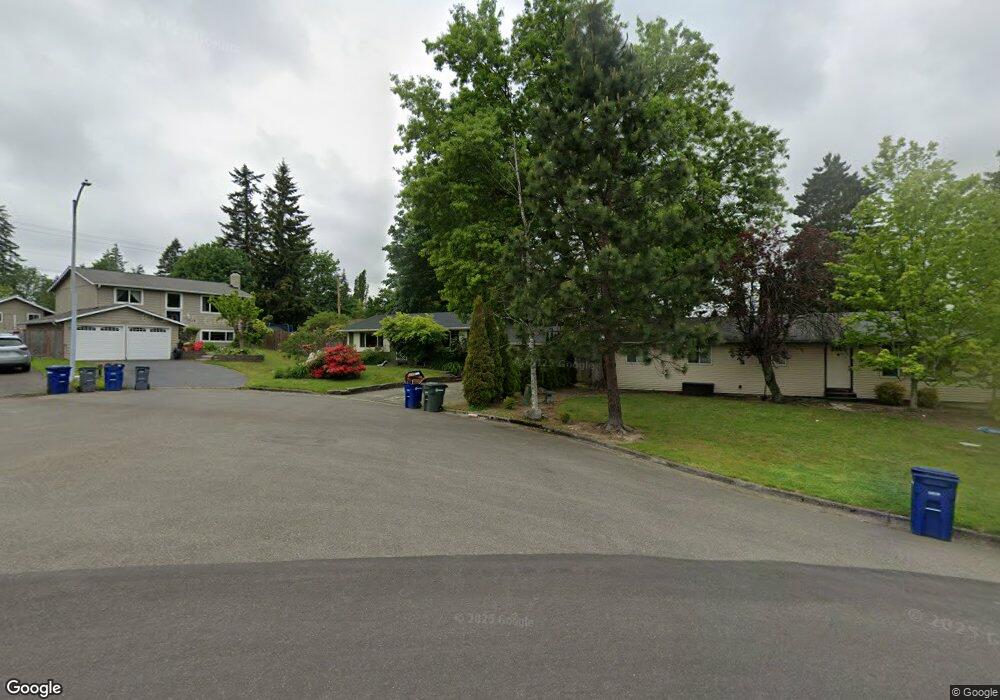
This home is located at 317 225th St SW, Bothell, WA 98021 and is currently estimated at $759,861, approximately $637 per square foot. 317 225th St SW is a home located in Snohomish County with nearby schools including Frank Love Elementary School, Kenmore Middle School, and Bothell High School.
Ownership History
Date
Name
Owned For
Owner Type
Purchase Details
Closed on
Sep 19, 2005
Sold by
Robledo W Servando and Robledo Jodi L
Bought by
Csokasy Leslie F
Current Estimated Value
Home Financials for this Owner
Home Financials are based on the most recent Mortgage that was taken out on this home.
Original Mortgage
$210,000
Outstanding Balance
$112,068
Interest Rate
5.81%
Mortgage Type
Fannie Mae Freddie Mac
Estimated Equity
$647,793
Purchase Details
Closed on
May 5, 2000
Sold by
Sukraw Gregory F and Sukraw Shannon
Bought by
Robledo W Servando and Robledo Jodi L
Home Financials for this Owner
Home Financials are based on the most recent Mortgage that was taken out on this home.
Original Mortgage
$177,909
Interest Rate
8.22%
Mortgage Type
FHA
Purchase Details
Closed on
Jan 29, 1998
Sold by
Williams Scott A and Williams Lisa M
Bought by
Sukraw Gregory F
Home Financials for this Owner
Home Financials are based on the most recent Mortgage that was taken out on this home.
Original Mortgage
$133,129
Interest Rate
7.05%
Mortgage Type
FHA
Create a Home Valuation Report for This Property
The Home Valuation Report is an in-depth analysis detailing your home's value as well as a comparison with similar homes in the area
Home Values in the Area
Average Home Value in this Area
Purchase History
| Date | Buyer | Sale Price | Title Company |
|---|---|---|---|
| Csokasy Leslie F | $295,000 | First American Title Ins Co | |
| Robledo W Servando | $180,000 | -- | |
| Sukraw Gregory F | $134,950 | -- |
Source: Public Records
Mortgage History
| Date | Status | Borrower | Loan Amount |
|---|---|---|---|
| Open | Csokasy Leslie F | $210,000 | |
| Previous Owner | Robledo W Servando | $177,909 | |
| Previous Owner | Sukraw Gregory F | $133,129 |
Source: Public Records
Tax History
| Year | Tax Paid | Tax Assessment Tax Assessment Total Assessment is a certain percentage of the fair market value that is determined by local assessors to be the total taxable value of land and additions on the property. | Land | Improvement |
|---|---|---|---|---|
| 2025 | $5,274 | $665,500 | $495,000 | $170,500 |
| 2024 | $5,274 | $615,500 | $445,000 | $170,500 |
| 2023 | $6,180 | $793,600 | $600,000 | $193,600 |
| 2022 | $5,751 | $596,300 | $430,000 | $166,300 |
| 2020 | $4,490 | $428,700 | $317,000 | $111,700 |
| 2019 | $3,823 | $376,500 | $265,000 | $111,500 |
| 2018 | $3,531 | $334,500 | $235,000 | $99,500 |
| 2017 | $2,895 | $275,400 | $185,000 | $90,400 |
| 2016 | $2,570 | $251,800 | $165,000 | $86,800 |
| 2015 | $2,753 | $257,400 | $155,000 | $102,400 |
| 2013 | $2,531 | $208,100 | $127,000 | $81,100 |
Source: Public Records
Map
Nearby Homes
- 308 225th St SW
- 531 221st St SW
- 22827 Meridian Ave S
- 422 216th St SW
- 18 232nd Place SW
- 17 232nd Place SE
- 23318 3rd Place W
- 22709 12th Place W
- 410 214th St SW Unit B
- 625 215th St SW
- 21723 3rd Ave SE
- 19924 7th Dr SE
- 20026 7th Dr SE
- 20021 7th Dr SE
- 242 xx 7th Ave SE
- 21414 2nd Ave SE
- 23619 5th Ave W
- 33 213th Place SW
- 604 213th St SW
- 931 236th Place SW
- 22418 3rd Place W
- 309 225th St SW
- 318 224th St SW
- 310 224th St SW
- 324 224th St SW
- 22426 3rd Place W
- 304 224th St SW
- 301 225th St SW
- 230 224th St SW
- 227 225th St SW
- 22508 3rd Place W
- 224 224th St SW
- 307 225th Place SW
- 228 225th St SW
- 221 225th St SW
- 22516 3rd Place W
- 231 225th Place SW
- 216 224th St SW
- 219 225th St SW
- 213 225th St SW
Your Personal Tour Guide
Ask me questions while you tour the home.