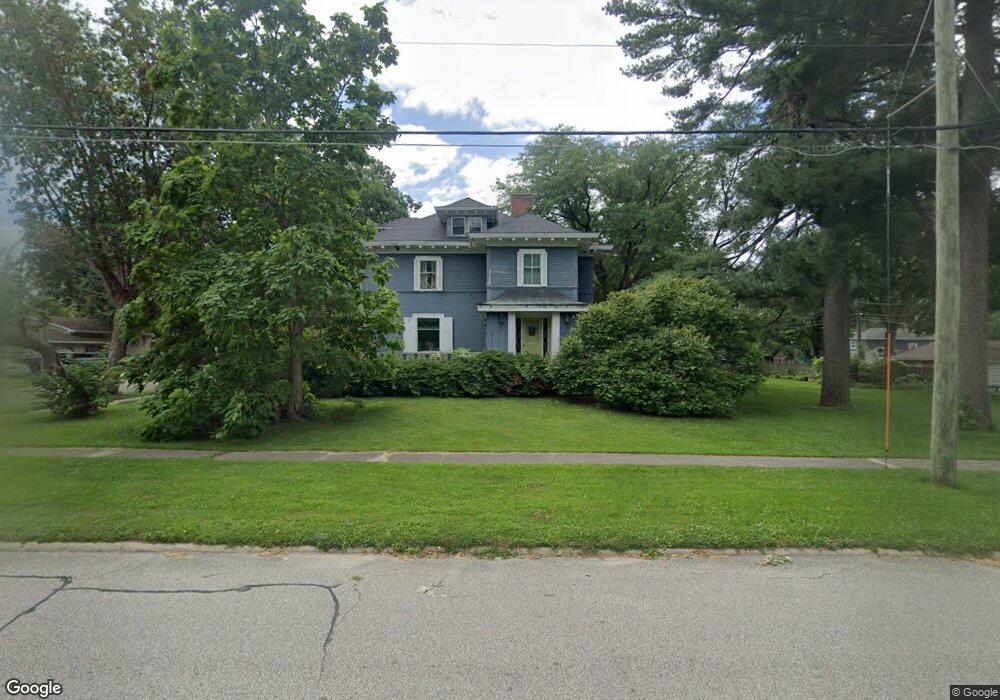
317 3rd St SE Independence, IA 50644
Estimated Value: $265,000 - $295,891
5
Beds
8
Baths
3,298
Sq Ft
$85/Sq Ft
Est. Value
About This Home
This home is located at 317 3rd St SE, Independence, IA 50644 and is currently estimated at $281,973, approximately $85 per square foot. 317 3rd St SE is a home located in Buchanan County with nearby schools including West Elementary School, East Elementary School, and Independence Junior/Senior High School.
Ownership History
Date
Name
Owned For
Owner Type
Purchase Details
Closed on
May 26, 2006
Sold by
Lounsberry Rentals Llc
Bought by
Johnson Robert A and Johnson Shelly J
Current Estimated Value
Home Financials for this Owner
Home Financials are based on the most recent Mortgage that was taken out on this home.
Original Mortgage
$156,000
Interest Rate
6.56%
Mortgage Type
New Conventional
Purchase Details
Closed on
Oct 10, 2004
Sold by
Lounsberry Rentals Llc
Bought by
Johnson Robert A and Johnson Shelly J
Create a Home Valuation Report for This Property
The Home Valuation Report is an in-depth analysis detailing your home's value as well as a comparison with similar homes in the area
Home Values in the Area
Average Home Value in this Area
Purchase History
| Date | Buyer | Sale Price | Title Company |
|---|---|---|---|
| Johnson Robert A | $157,000 | None Available | |
| Johnson Robert A | $157,000 | None Available |
Source: Public Records
Mortgage History
| Date | Status | Borrower | Loan Amount |
|---|---|---|---|
| Closed | Johnson Robert A | $156,000 | |
| Closed | Johnson Robert A | $0 |
Source: Public Records
Tax History Compared to Growth
Tax History
| Year | Tax Paid | Tax Assessment Tax Assessment Total Assessment is a certain percentage of the fair market value that is determined by local assessors to be the total taxable value of land and additions on the property. | Land | Improvement |
|---|---|---|---|---|
| 2025 | $4,444 | $284,290 | $55,510 | $228,780 |
| 2024 | $4,444 | $245,790 | $49,560 | $196,230 |
| 2023 | $4,438 | $245,790 | $49,560 | $196,230 |
| 2022 | $3,960 | $197,060 | $39,340 | $157,720 |
| 2021 | $3,928 | $197,060 | $39,340 | $157,720 |
| 2020 | $3,928 | $181,410 | $36,060 | $145,350 |
| 2019 | $3,852 | $181,410 | $36,060 | $145,350 |
| 2018 | $3,690 | $175,810 | $36,060 | $139,750 |
| 2017 | $3,894 | $175,810 | $36,060 | $139,750 |
| 2016 | $3,832 | $182,540 | $19,500 | $163,040 |
| 2015 | $3,832 | $182,540 | $19,500 | $163,040 |
| 2014 | $3,908 | $182,540 | $19,500 | $163,040 |
Source: Public Records
Map
Nearby Homes