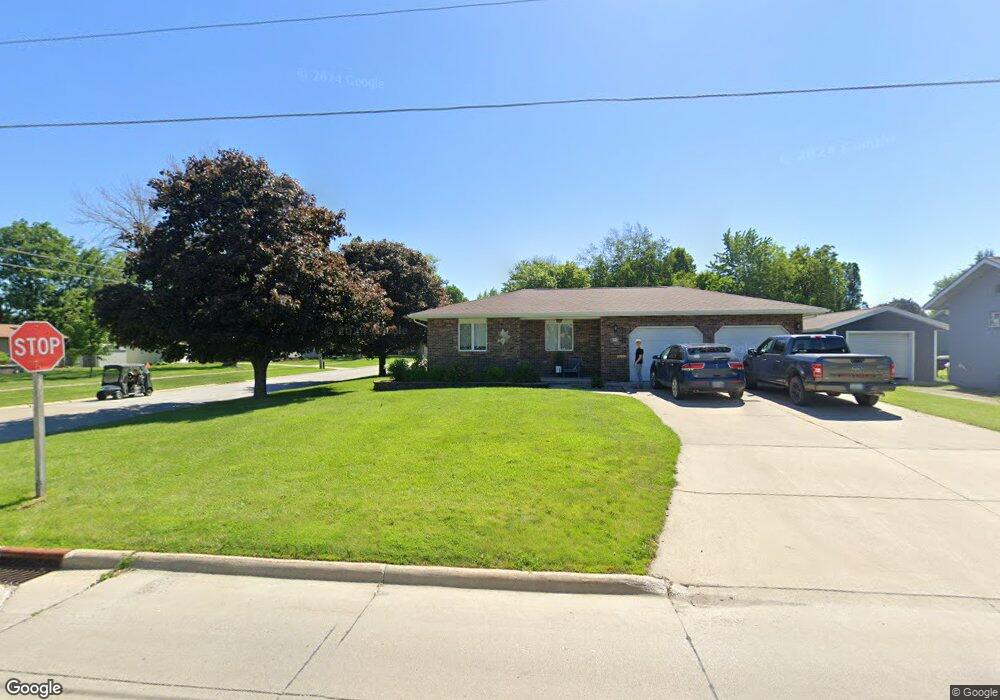
317 6th St NE Clarion, IA 50525
Estimated Value: $249,000 - $321,000
3
Beds
3
Baths
1,996
Sq Ft
$138/Sq Ft
Est. Value
About This Home
This home is located at 317 6th St NE, Clarion, IA 50525 and is currently estimated at $274,986, approximately $137 per square foot. 317 6th St NE is a home located in Wright County with nearby schools including Clarion-Goldfield-Dows Elementary School, Clarion-Goldfield-Dows Middle School, and Clarion-Goldfield-Dows High School.
Ownership History
Date
Name
Owned For
Owner Type
Purchase Details
Closed on
Jan 7, 2022
Sold by
Adrian Ulven Brent and Adrian Ann Denise
Bought by
Stumpf Jason T and Stumpf Samantha M
Current Estimated Value
Home Financials for this Owner
Home Financials are based on the most recent Mortgage that was taken out on this home.
Original Mortgage
$205,600
Outstanding Balance
$161,763
Interest Rate
2.33%
Mortgage Type
New Conventional
Estimated Equity
$113,223
Create a Home Valuation Report for This Property
The Home Valuation Report is an in-depth analysis detailing your home's value as well as a comparison with similar homes in the area
Home Values in the Area
Average Home Value in this Area
Purchase History
| Date | Buyer | Sale Price | Title Company |
|---|---|---|---|
| Stumpf Jason T | $257,000 | None Listed On Document |
Source: Public Records
Mortgage History
| Date | Status | Borrower | Loan Amount |
|---|---|---|---|
| Open | Stumpf Jason T | $205,600 |
Source: Public Records
Tax History Compared to Growth
Tax History
| Year | Tax Paid | Tax Assessment Tax Assessment Total Assessment is a certain percentage of the fair market value that is determined by local assessors to be the total taxable value of land and additions on the property. | Land | Improvement |
|---|---|---|---|---|
| 2025 | $4,350 | $234,100 | $9,900 | $224,200 |
| 2024 | $4,350 | $227,100 | $9,900 | $217,200 |
| 2023 | $4,328 | $227,100 | $9,900 | $217,200 |
| 2022 | $3,398 | $190,900 | $9,900 | $181,000 |
| 2021 | $3,398 | $159,800 | $9,900 | $149,900 |
| 2020 | $3,450 | $163,800 | $9,900 | $153,900 |
| 2019 | $3,240 | $153,100 | $0 | $0 |
| 2018 | $3,260 | $153,100 | $0 | $0 |
| 2017 | $3,192 | $150,500 | $0 | $0 |
| 2016 | $3,060 | $150,500 | $0 | $0 |
| 2015 | $2,926 | $150,500 | $0 | $0 |
| 2014 | $2,926 | $145,300 | $0 | $0 |
Source: Public Records
Map
Nearby Homes