317 Binns Loop Crossett, AR 71635
Estimated Value: $69,000 - $105,000
Studio
1
Bath
912
Sq Ft
$91/Sq Ft
Est. Value
About This Home
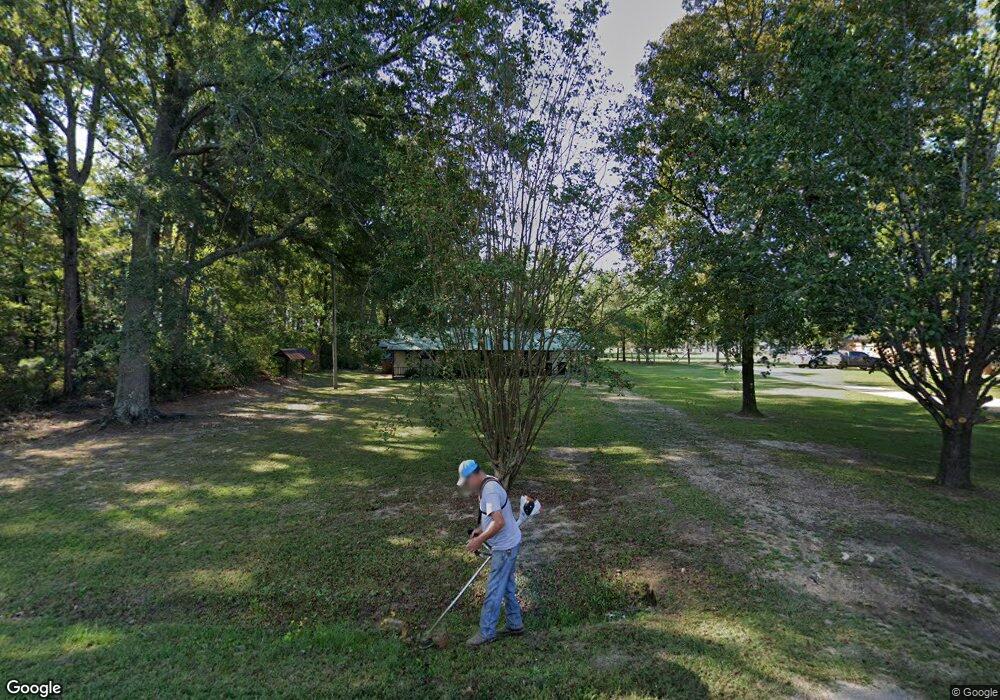
This home is located at 317 Binns Loop, Crossett, AR 71635 and is currently estimated at $83,087, approximately $91 per square foot. 317 Binns Loop is a home located in Ashley County with nearby schools including Crossett Elementary School, Crossett Middle School, and Crossett High School.
Ownership History
Date
Name
Owned For
Owner Type
Purchase Details
Closed on
Feb 14, 1978
Bought by
Swan Joe H and Swan Laverne
Current Estimated Value
Purchase Details
Closed on
Feb 22, 1972
Bought by
Chance Donald Frank and Chance Yvonne
Purchase Details
Closed on
Feb 22, 1971
Bought by
Chance Charles Leon and Chance Wanda
Purchase Details
Closed on
Feb 19, 1971
Bought by
Harris Billy E
Purchase Details
Closed on
Nov 22, 1969
Bought by
Harris Billy E and Harris Ute B
Purchase Details
Closed on
Nov 18, 1969
Bought by
Harris Billy E and Harris Ute B
Create a Home Valuation Report for This Property
The Home Valuation Report is an in-depth analysis detailing your home's value as well as a comparison with similar homes in the area
Home Values in the Area
Average Home Value in this Area
Purchase History
| Date | Buyer | Sale Price | Title Company |
|---|---|---|---|
| Swan Joe H | -- | -- | |
| Chance Donald Frank | -- | -- | |
| Chance Charles Leon | -- | -- | |
| Harris Billy E | -- | -- | |
| Harris Billy E | -- | -- | |
| Harris Billy E | -- | -- |
Source: Public Records
Tax History
| Year | Tax Paid | Tax Assessment Tax Assessment Total Assessment is a certain percentage of the fair market value that is determined by local assessors to be the total taxable value of land and additions on the property. | Land | Improvement |
|---|---|---|---|---|
| 2025 | $460 | $11,080 | $1,830 | $9,250 |
| 2024 | $424 | $11,080 | $1,830 | $9,250 |
| 2023 | $389 | $11,080 | $1,830 | $9,250 |
| 2022 | $354 | $7,480 | $1,350 | $6,130 |
| 2021 | $354 | $7,480 | $1,350 | $6,130 |
| 2020 | $170 | $7,480 | $1,350 | $6,130 |
| 2019 | $0 | $7,480 | $1,350 | $6,130 |
| 2018 | $0 | $7,480 | $1,350 | $6,130 |
| 2017 | $0 | $7,100 | $1,130 | $5,970 |
| 2016 | -- | $6,440 | $1,130 | $5,310 |
| 2015 | -- | $6,440 | $1,130 | $5,310 |
| 2014 | -- | $6,440 | $1,130 | $5,310 |
Source: Public Records
Map
Nearby Homes
- 1492 Highway 52 W
- 1710 Gardenia St
- 293 Ashley 491 Rd
- 186 E Pierce St
- 1428 James St
- 0 Ashley Rd Unit 25018760
- 1436 Mimosa St
- 210 Willis St
- 0 Ashley Road 20
- 905 Patton Dr
- 267 Ashley Road 16
- 000 Fairview Rd Hwy 133 N
- 600 Patton Dr
- 0 Ashley 461
- 145 Unity Ln
- 402 Elm St
- 603 Walnut St
- 702 Pecan St
- 506 N Carolina St
- 905 Cedar St
Your Personal Tour Guide
Ask me questions while you tour the home.