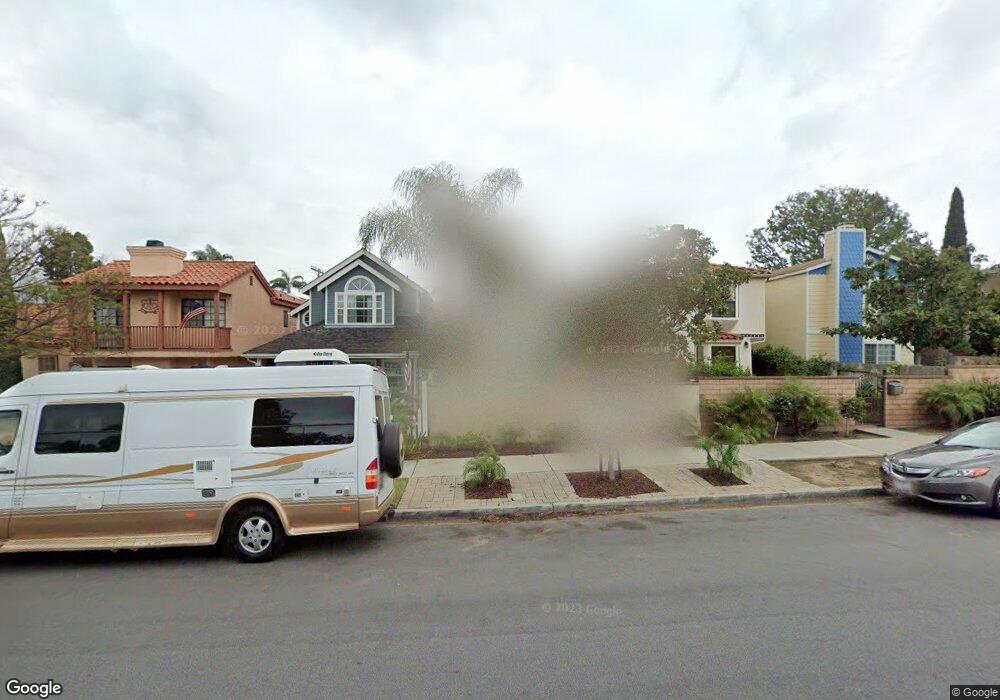
317 C Ave Coronado, CA 92118
Estimated Value: $2,474,000 - $2,910,000
4
Beds
4
Baths
2,325
Sq Ft
$1,146/Sq Ft
Est. Value
About This Home
This home is located at 317 C Ave, Coronado, CA 92118 and is currently estimated at $2,664,217, approximately $1,145 per square foot. 317 C Ave is a home located in San Diego County with nearby schools including Coronado Village Elementary, Coronado Middle School, and Coronado High School.
Ownership History
Date
Name
Owned For
Owner Type
Purchase Details
Closed on
Jun 11, 2010
Sold by
Dawson James Cutler and Dawson Deborah L
Bought by
Dawson James Cutler
Current Estimated Value
Home Financials for this Owner
Home Financials are based on the most recent Mortgage that was taken out on this home.
Original Mortgage
$400,000
Outstanding Balance
$267,291
Interest Rate
4.91%
Mortgage Type
New Conventional
Estimated Equity
$2,396,926
Purchase Details
Closed on
Dec 31, 1986
Bought by
Dawson James C Jr Deborah L
Purchase Details
Closed on
Jul 15, 1985
Create a Home Valuation Report for This Property
The Home Valuation Report is an in-depth analysis detailing your home's value as well as a comparison with similar homes in the area
Home Values in the Area
Average Home Value in this Area
Purchase History
| Date | Buyer | Sale Price | Title Company |
|---|---|---|---|
| Dawson James Cutler | -- | Accommodation | |
| Dawson James C Jr Deborah L | $245,000 | -- | |
| -- | $327,000 | -- |
Source: Public Records
Mortgage History
| Date | Status | Borrower | Loan Amount |
|---|---|---|---|
| Open | Dawson James Cutler | $400,000 |
Source: Public Records
Tax History
| Year | Tax Paid | Tax Assessment Tax Assessment Total Assessment is a certain percentage of the fair market value that is determined by local assessors to be the total taxable value of land and additions on the property. | Land | Improvement |
|---|---|---|---|---|
| 2025 | $5,563 | $478,303 | $253,796 | $224,507 |
| 2024 | $5,563 | $468,925 | $248,820 | $220,105 |
| 2023 | $5,481 | $459,732 | $243,942 | $215,790 |
| 2022 | $5,385 | $450,718 | $239,159 | $211,559 |
| 2021 | $5,313 | $441,881 | $234,470 | $207,411 |
| 2020 | $5,177 | $437,351 | $232,066 | $205,285 |
| 2019 | $5,162 | $428,776 | $227,516 | $201,260 |
| 2018 | $5,081 | $420,369 | $223,055 | $197,314 |
| 2017 | $4,966 | $412,128 | $218,682 | $193,446 |
| 2016 | $4,795 | $404,048 | $214,395 | $189,653 |
| 2015 | $4,695 | $397,980 | $211,175 | $186,805 |
| 2014 | $4,557 | $390,185 | $207,039 | $183,146 |
Source: Public Records
Map
Nearby Homes
Your Personal Tour Guide
Ask me questions while you tour the home.