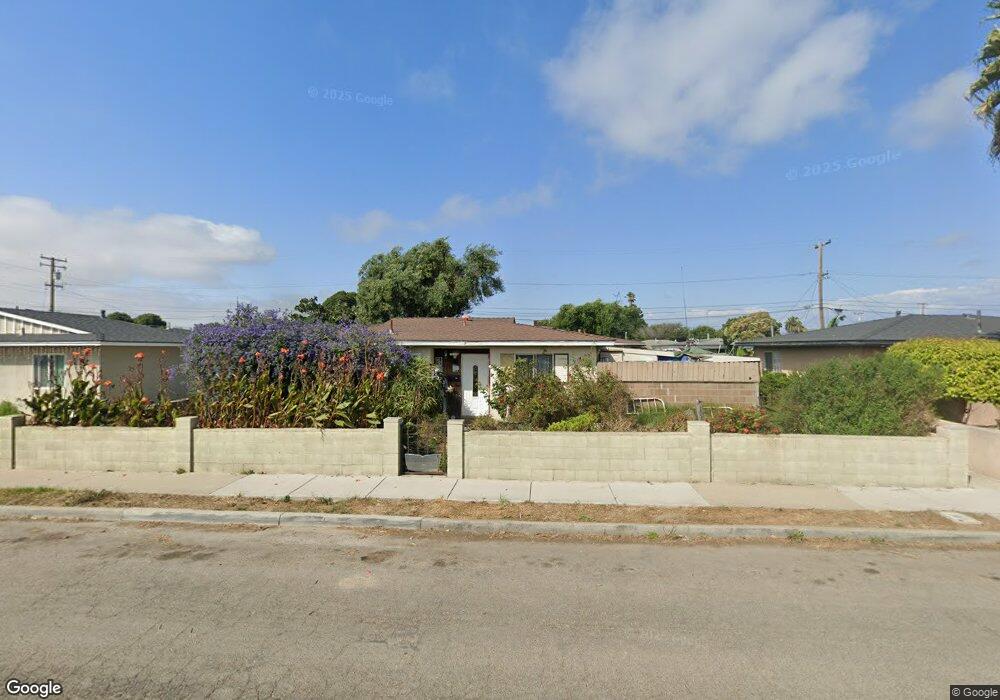
317 E Prune Ave Lompoc, CA 93436
Estimated Value: $534,000 - $678,000
5
Beds
3
Baths
1,980
Sq Ft
$309/Sq Ft
Est. Value
About This Home
This home is located at 317 E Prune Ave, Lompoc, CA 93436 and is currently estimated at $611,737, approximately $308 per square foot. 317 E Prune Ave is a home located in Santa Barbara County with nearby schools including La Honda STEAM Academy, Cabrillo High School, and Olive Grove Charter - Lompoc.
Ownership History
Date
Name
Owned For
Owner Type
Purchase Details
Closed on
Aug 13, 2024
Sold by
Carrington Foreclosure Services Llc
Bought by
Hollyvale Rental Holdings Llc
Current Estimated Value
Purchase Details
Closed on
Feb 18, 2023
Sold by
Mckenna Joe
Bought by
Mckenna Joe and Mckenna Ruth
Purchase Details
Closed on
May 12, 2010
Sold by
Petker Max H
Bought by
Mckenna Joe and Mckenna Ruth
Home Financials for this Owner
Home Financials are based on the most recent Mortgage that was taken out on this home.
Original Mortgage
$171,830
Interest Rate
5.25%
Mortgage Type
FHA
Purchase Details
Closed on
Feb 20, 2008
Sold by
Petker Hedwig R
Bought by
Petker Hedwig R
Home Financials for this Owner
Home Financials are based on the most recent Mortgage that was taken out on this home.
Original Mortgage
$510,000
Interest Rate
3.1%
Mortgage Type
Reverse Mortgage Home Equity Conversion Mortgage
Purchase Details
Closed on
Apr 5, 2001
Sold by
Petker Hedwig R
Bought by
Petker Hedwig R
Create a Home Valuation Report for This Property
The Home Valuation Report is an in-depth analysis detailing your home's value as well as a comparison with similar homes in the area
Home Values in the Area
Average Home Value in this Area
Purchase History
| Date | Buyer | Sale Price | Title Company |
|---|---|---|---|
| Hollyvale Rental Holdings Llc | $400,000 | Usa National Title | |
| Mckenna Joe | -- | -- | |
| Mckenna Joe | $175,000 | First American Title Company | |
| Petker Hedwig R | -- | Orange Coast Title | |
| Petker Hedwig R | -- | -- |
Source: Public Records
Mortgage History
| Date | Status | Borrower | Loan Amount |
|---|---|---|---|
| Previous Owner | Mckenna Joe | $171,830 | |
| Previous Owner | Petker Hedwig R | $510,000 |
Source: Public Records
Tax History
| Year | Tax Paid | Tax Assessment Tax Assessment Total Assessment is a certain percentage of the fair market value that is determined by local assessors to be the total taxable value of land and additions on the property. | Land | Improvement |
|---|---|---|---|---|
| 2025 | $2,404 | $575,000 | $160,000 | $415,000 |
| 2023 | $2,404 | $217,108 | $86,842 | $130,266 |
| 2022 | $2,358 | $212,852 | $85,140 | $127,712 |
| 2021 | $2,382 | $208,679 | $83,471 | $125,208 |
| 2020 | $2,356 | $206,541 | $82,616 | $123,925 |
| 2019 | $2,316 | $202,493 | $80,997 | $121,496 |
| 2018 | $2,278 | $198,523 | $79,409 | $119,114 |
| 2017 | $2,235 | $194,631 | $77,852 | $116,779 |
| 2016 | $2,193 | $190,816 | $76,326 | $114,490 |
| 2014 | $2,144 | $184,270 | $73,708 | $110,562 |
Source: Public Records
Map
Nearby Homes
- 610 E Pine Ave Unit 10
- 610 E Pine Ave Unit 29
- 610 E Pine Ave Unit 62
- 533 N G St
- 510 N I St
- 701 E Pine Ave Unit 182
- 701 E Pine Ave Unit 176
- 701 E Pine Ave Unit 171
- 701 E Pine Ave Unit 161
- 505 N 1st St
- 516 N 2nd St
- 526 N L St
- 127 N E St
- 321 N Third St
- 240 Quail Cir
- 321 W North Ave Unit 133
- 117 S I St
- 1100 N Third St
- 217 N M St
- 205 S E St
Your Personal Tour Guide
Ask me questions while you tour the home.