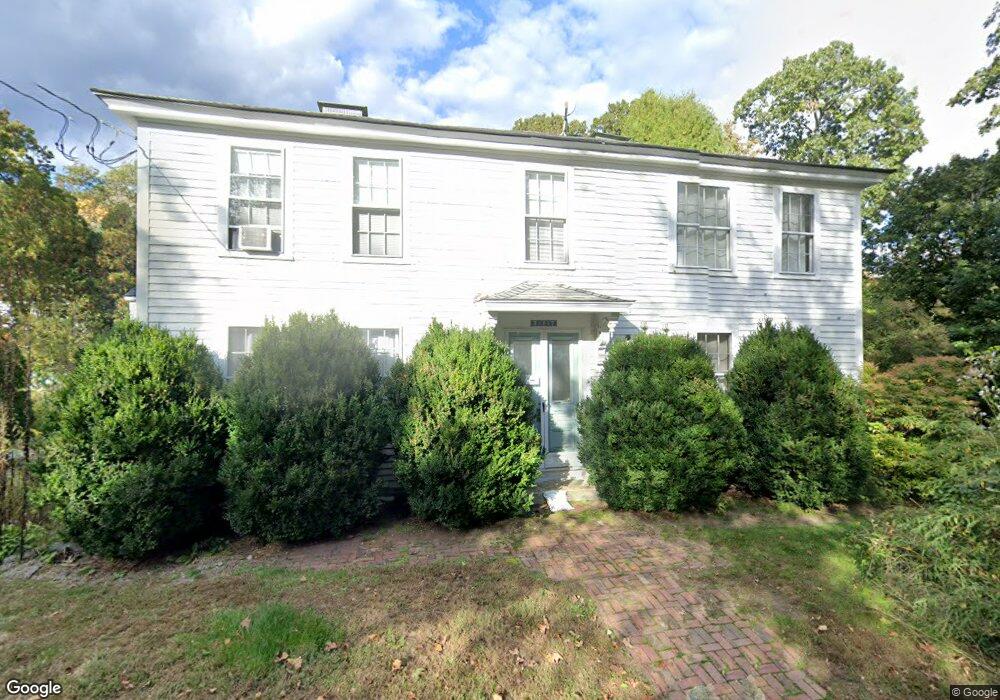
317 Glen Rd Unit 317 Weston, MA 02493
Estimated Value: $1,443,796 - $1,636,000
3
Beds
2
Baths
1,928
Sq Ft
$797/Sq Ft
Est. Value
About This Home
This home is located at 317 Glen Rd Unit 317, Weston, MA 02493 and is currently estimated at $1,536,449, approximately $796 per square foot. 317 Glen Rd Unit 317 is a home located in Middlesex County with nearby schools including Country Elementary School, Woodland Elementary School, and Weston Middle School.
Ownership History
Date
Name
Owned For
Owner Type
Purchase Details
Closed on
Jan 6, 2023
Sold by
Khoory Salwa
Bought by
Khoory Ghassan
Current Estimated Value
Purchase Details
Closed on
Aug 13, 2015
Sold by
Watson Conrad and Watson Serena
Bought by
Khoory Salwa
Home Financials for this Owner
Home Financials are based on the most recent Mortgage that was taken out on this home.
Original Mortgage
$450,000
Interest Rate
3%
Mortgage Type
New Conventional
Purchase Details
Closed on
Aug 15, 2003
Sold by
Fiels Keith M and Fiels Margie Epple
Bought by
Watson Conrad and Watson Serena
Create a Home Valuation Report for This Property
The Home Valuation Report is an in-depth analysis detailing your home's value as well as a comparison with similar homes in the area
Home Values in the Area
Average Home Value in this Area
Purchase History
| Date | Buyer | Sale Price | Title Company |
|---|---|---|---|
| Khoory Ghassan | -- | None Available | |
| Khoory Salwa | $900,000 | -- | |
| Watson Conrad | $850,000 | -- |
Source: Public Records
Mortgage History
| Date | Status | Borrower | Loan Amount |
|---|---|---|---|
| Previous Owner | Khoory Salwa | $450,000 |
Source: Public Records
Tax History Compared to Growth
Tax History
| Year | Tax Paid | Tax Assessment Tax Assessment Total Assessment is a certain percentage of the fair market value that is determined by local assessors to be the total taxable value of land and additions on the property. | Land | Improvement |
|---|---|---|---|---|
| 2025 | $11,637 | $1,048,400 | $784,800 | $263,600 |
| 2024 | $11,544 | $1,038,100 | $784,800 | $253,300 |
| 2023 | $12,245 | $1,034,200 | $784,800 | $249,400 |
| 2022 | $12,007 | $937,300 | $750,000 | $187,300 |
| 2021 | $11,585 | $892,500 | $712,200 | $180,300 |
| 2020 | $11,451 | $892,500 | $712,200 | $180,300 |
| 2019 | $11,206 | $890,100 | $712,200 | $177,900 |
| 2018 | $11,093 | $886,700 | $712,200 | $174,500 |
| 2017 | $10,995 | $886,700 | $712,200 | $174,500 |
| 2016 | $10,782 | $886,700 | $712,200 | $174,500 |
| 2015 | $10,187 | $829,600 | $679,200 | $150,400 |
Source: Public Records
Map
Nearby Homes