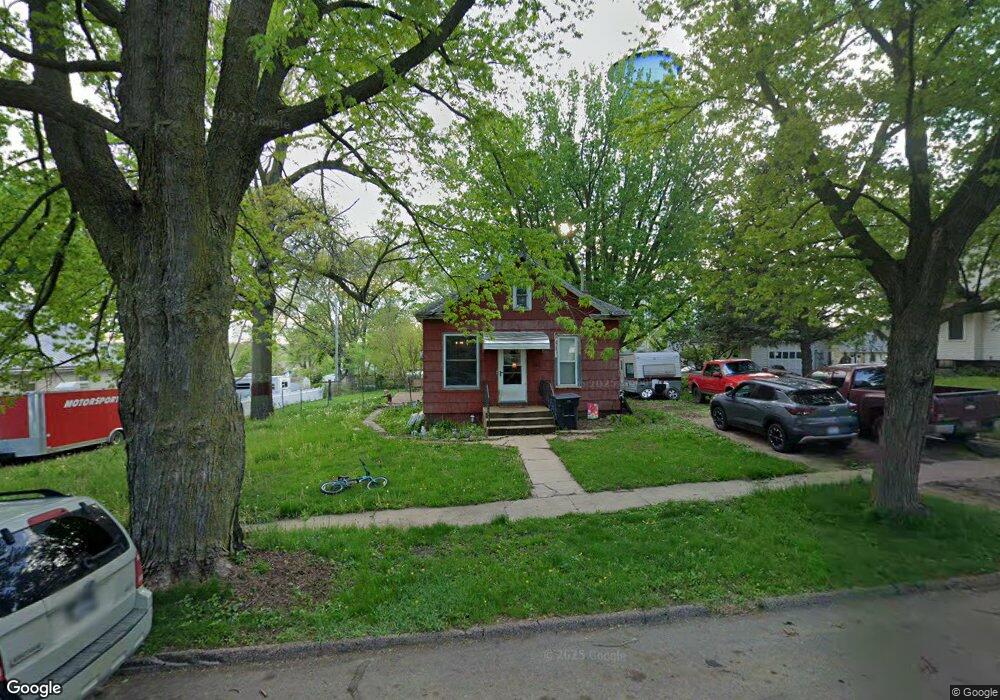
317 Main St Pierson, IA 51048
Estimated Value: $54,281 - $80,000
2
Beds
1
Bath
1,008
Sq Ft
$70/Sq Ft
Est. Value
About This Home
This home is located at 317 Main St, Pierson, IA 51048 and is currently estimated at $70,094, approximately $69 per square foot. 317 Main St is a home located in Woodbury County with nearby schools including Pierson Elementary School, Pierson Middle School, and Kingsley-Pierson High School.
Ownership History
Date
Name
Owned For
Owner Type
Purchase Details
Closed on
Aug 24, 2022
Sold by
Vitito Denton J
Bought by
Brown Bradley P and Brown Sabrina L
Current Estimated Value
Purchase Details
Closed on
Feb 4, 2005
Sold by
Sheridan-Nebo Jane R and Sheridan Jane R
Bought by
Jorgensen Kerry
Home Financials for this Owner
Home Financials are based on the most recent Mortgage that was taken out on this home.
Original Mortgage
$16,000
Interest Rate
5.83%
Mortgage Type
New Conventional
Create a Home Valuation Report for This Property
The Home Valuation Report is an in-depth analysis detailing your home's value as well as a comparison with similar homes in the area
Home Values in the Area
Average Home Value in this Area
Purchase History
| Date | Buyer | Sale Price | Title Company |
|---|---|---|---|
| Brown Bradley P | $81,500 | -- | |
| Jorgensen Kerry | $32,000 | None Available |
Source: Public Records
Mortgage History
| Date | Status | Borrower | Loan Amount |
|---|---|---|---|
| Closed | Jorgensen Kerry | $16,000 |
Source: Public Records
Tax History Compared to Growth
Tax History
| Year | Tax Paid | Tax Assessment Tax Assessment Total Assessment is a certain percentage of the fair market value that is determined by local assessors to be the total taxable value of land and additions on the property. | Land | Improvement |
|---|---|---|---|---|
| 2025 | $654 | $33,290 | $4,940 | $28,350 |
| 2024 | $654 | $36,570 | $4,940 | $31,630 |
| 2023 | $406 | $36,570 | $4,940 | $31,630 |
| 2022 | $398 | $28,090 | $4,940 | $23,150 |
| 2021 | $398 | $28,090 | $4,940 | $23,150 |
| 2020 | $390 | $27,040 | $5,290 | $21,750 |
| 2019 | $374 | $27,040 | $5,290 | $21,750 |
| 2018 | $382 | $25,490 | $5,290 | $20,200 |
| 2017 | $382 | $25,490 | $5,290 | $20,200 |
| 2016 | $308 | $25,490 | $0 | $0 |
| 2015 | $477 | $23,820 | $4,940 | $18,880 |
| 2014 | $274 | $23,820 | $4,940 | $18,880 |
Source: Public Records
Map
Nearby Homes