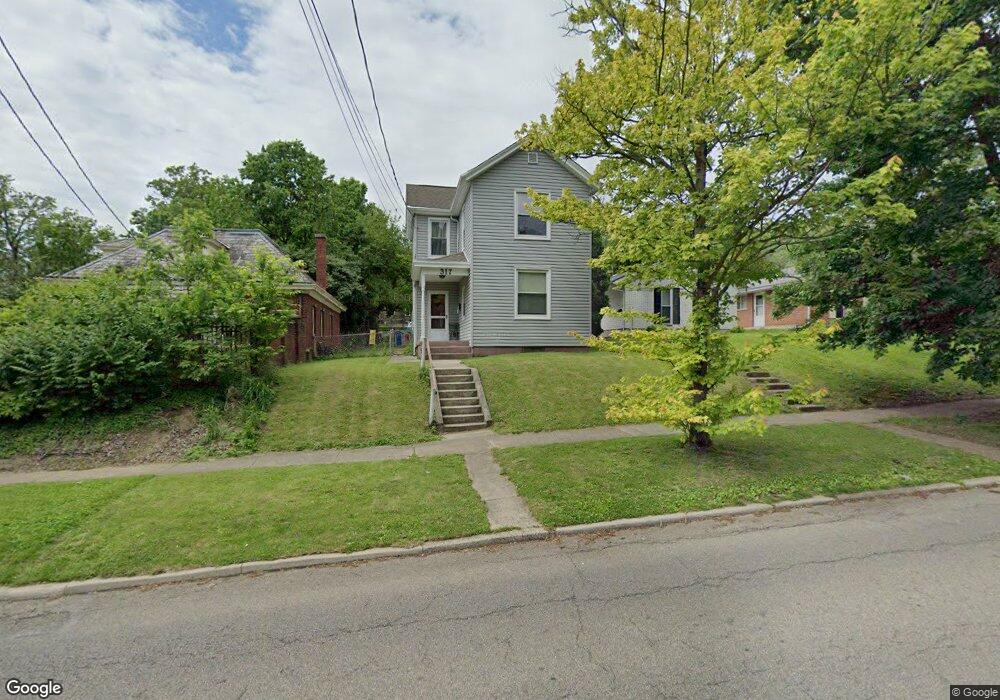
317 Millikin St Hamilton, OH 45013
Estimated Value: $175,152 - $267,000
2
Beds
2
Baths
1,581
Sq Ft
$132/Sq Ft
Est. Value
About This Home
This home is located at 317 Millikin St, Hamilton, OH 45013 and is currently estimated at $208,288, approximately $131 per square foot. 317 Millikin St is a home located in Butler County with nearby schools including Ridgeway Elementary School, Wilson Middle School, and Hamilton High School Main Campus.
Ownership History
Date
Name
Owned For
Owner Type
Purchase Details
Closed on
Aug 14, 1996
Sold by
Shelton & Sons Dev Inc
Bought by
Buell Carl W and Buell Jan
Current Estimated Value
Home Financials for this Owner
Home Financials are based on the most recent Mortgage that was taken out on this home.
Original Mortgage
$67,850
Outstanding Balance
$3,930
Interest Rate
8.18%
Mortgage Type
FHA
Estimated Equity
$204,358
Purchase Details
Closed on
Jan 12, 1996
Sold by
Coggeshell Kenneth W
Bought by
Shelton & Sons Dev Inc
Create a Home Valuation Report for This Property
The Home Valuation Report is an in-depth analysis detailing your home's value as well as a comparison with similar homes in the area
Home Values in the Area
Average Home Value in this Area
Purchase History
| Date | Buyer | Sale Price | Title Company |
|---|---|---|---|
| Buell Carl W | $67,500 | -- | |
| Shelton & Sons Dev Inc | $69,900 | -- |
Source: Public Records
Mortgage History
| Date | Status | Borrower | Loan Amount |
|---|---|---|---|
| Open | Buell Carl W | $67,850 |
Source: Public Records
Tax History
| Year | Tax Paid | Tax Assessment Tax Assessment Total Assessment is a certain percentage of the fair market value that is determined by local assessors to be the total taxable value of land and additions on the property. | Land | Improvement |
|---|---|---|---|---|
| 2025 | $1,103 | $35,610 | $7,050 | $28,560 |
| 2024 | $1,103 | $35,610 | $7,050 | $28,560 |
| 2023 | $1,111 | $36,800 | $7,050 | $29,750 |
| 2022 | $884 | $26,070 | $7,050 | $19,020 |
| 2021 | $749 | $25,270 | $7,050 | $18,220 |
| 2020 | $780 | $25,270 | $7,050 | $18,220 |
| 2019 | $1,858 | $25,380 | $6,560 | $18,820 |
| 2018 | $774 | $25,380 | $6,560 | $18,820 |
| 2017 | $781 | $25,380 | $6,560 | $18,820 |
| 2016 | $735 | $23,660 | $6,560 | $17,100 |
| 2015 | $731 | $23,660 | $6,560 | $17,100 |
| 2014 | $664 | $23,660 | $6,560 | $17,100 |
| 2013 | $664 | $23,210 | $6,560 | $16,650 |
Source: Public Records
Map
Nearby Homes
Your Personal Tour Guide
Ask me questions while you tour the home.