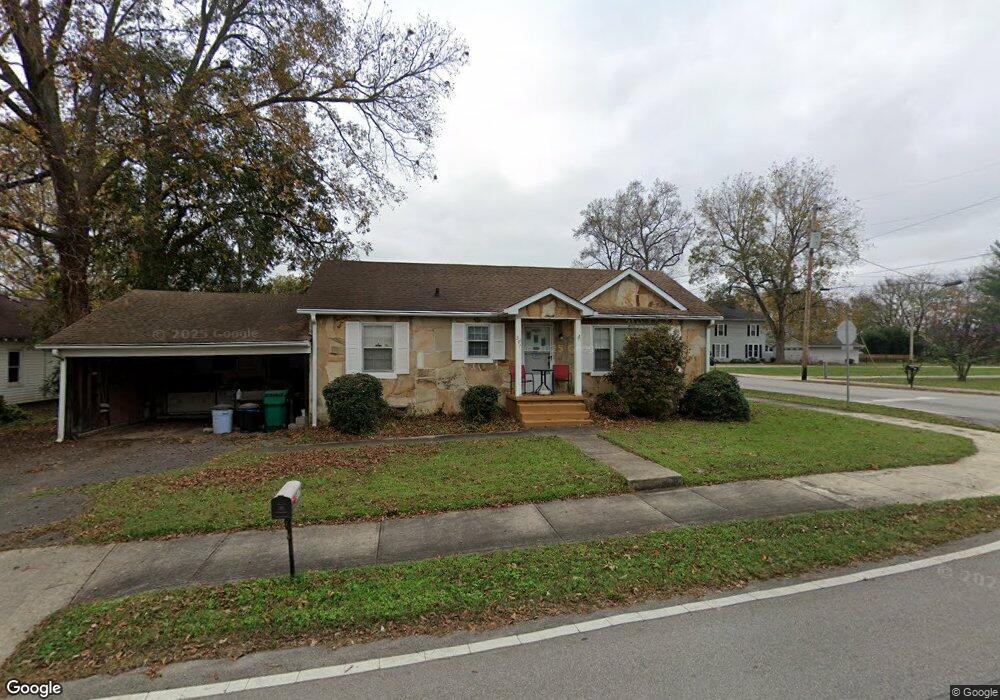
317 N Cedar St Winchester, TN 37398
Estimated Value: $102,854 - $187,000
--
Bed
1
Bath
1,014
Sq Ft
$150/Sq Ft
Est. Value
About This Home
This home is located at 317 N Cedar St, Winchester, TN 37398 and is currently estimated at $152,214, approximately $150 per square foot. 317 N Cedar St is a home located in Franklin County with nearby schools including South Middle School, Franklin County High School, and Winchester Christian Academy.
Ownership History
Date
Name
Owned For
Owner Type
Purchase Details
Closed on
Mar 13, 2018
Sold by
Smith Erritt Brandon
Bought by
Smith Christopher Chad and Farris Jan D
Current Estimated Value
Purchase Details
Closed on
Feb 8, 2017
Sold by
Maxwell Mary Griggs
Bought by
Smith Erritt Brandon and Smith Christopher Chad
Purchase Details
Closed on
Apr 17, 2003
Bought by
Smith Brandon Erritt and Farris Jan D
Purchase Details
Closed on
Sep 9, 1998
Sold by
Albertson Robert L
Bought by
Smith Erritt B and Smith Evinn
Purchase Details
Closed on
Sep 8, 1998
Bought by
Smith Brandon Erritt and Evinn Landon Smith
Purchase Details
Closed on
Sep 25, 1996
Bought by
Albertson Robert L and Albertson Sherry A
Purchase Details
Closed on
Sep 20, 1996
Bought by
Albertson Robert L and Albertson Sherry A
Purchase Details
Closed on
Apr 9, 1987
Bought by
Rogers Michael K
Purchase Details
Closed on
May 7, 1984
Purchase Details
Closed on
Jul 21, 1977
Purchase Details
Closed on
Jun 21, 1974
Create a Home Valuation Report for This Property
The Home Valuation Report is an in-depth analysis detailing your home's value as well as a comparison with similar homes in the area
Home Values in the Area
Average Home Value in this Area
Purchase History
| Date | Buyer | Sale Price | Title Company |
|---|---|---|---|
| Smith Christopher Chad | -- | Southern Tennessee Title | |
| Smith Erritt Brandon | $17,967 | -- | |
| Smith Brandon Erritt | $15,300 | -- | |
| Smith Erritt B | $38,157 | -- | |
| Smith Brandon Erritt | $38,200 | -- | |
| Albertson Robert L | $36,100 | -- | |
| Albertson Robert L | $36,100 | -- | |
| Rogers Michael K | -- | -- | |
| -- | -- | -- | |
| -- | -- | -- | |
| -- | -- | -- |
Source: Public Records
Tax History Compared to Growth
Tax History
| Year | Tax Paid | Tax Assessment Tax Assessment Total Assessment is a certain percentage of the fair market value that is determined by local assessors to be the total taxable value of land and additions on the property. | Land | Improvement |
|---|---|---|---|---|
| 2024 | $522 | $20,325 | $1,375 | $18,950 |
| 2023 | $522 | $20,325 | $1,375 | $18,950 |
| 2022 | $512 | $20,325 | $1,375 | $18,950 |
| 2021 | $350 | $20,325 | $1,375 | $18,950 |
| 2020 | $483 | $13,675 | $950 | $12,725 |
| 2019 | $483 | $13,675 | $950 | $12,725 |
| 2018 | $455 | $13,675 | $950 | $12,725 |
| 2017 | $455 | $13,675 | $950 | $12,725 |
| 2016 | $449 | $13,475 | $950 | $12,525 |
| 2015 | $440 | $13,475 | $950 | $12,525 |
| 2014 | $440 | $13,467 | $0 | $0 |
Source: Public Records
Map
Nearby Homes
- 301 N Shephard St
- 109 N Shephard St
- 105 N Shephard St
- 311 N Jefferson St
- 209 N Jefferson St
- 503 Elm St
- 408 Style St
- 203 Campfire Ct
- 407 Style St
- 201&203 3rd Ave NE
- 407 Girton St
- 203 3rd Ave NE
- 508 6th Ave NW
- 146 Island Way
- 303 N Porter St
- 706 N Vine St
- 0 N Porter St
- 713 N Vine St
- 105 Island Way
- 115 Heath Ln