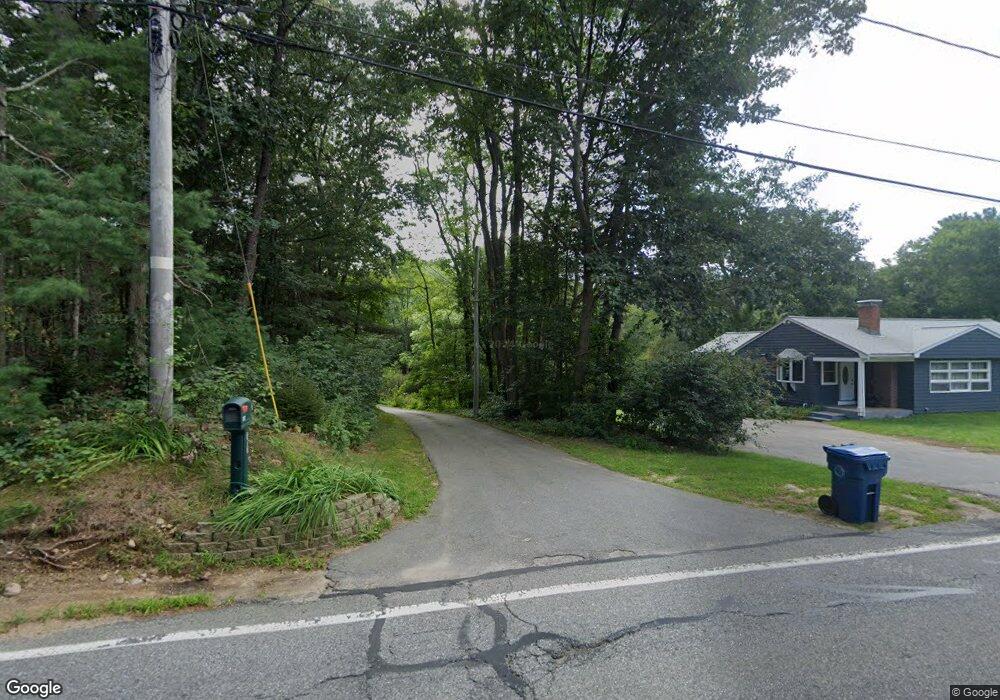
317 Nashua Rd Billerica, MA 01821
Estimated Value: $785,000 - $831,000
3
Beds
2
Baths
2,033
Sq Ft
$397/Sq Ft
Est. Value
About This Home
This home is located at 317 Nashua Rd, Billerica, MA 01821 and is currently estimated at $806,483, approximately $396 per square foot. 317 Nashua Rd is a home located in Middlesex County with nearby schools including Billerica Memorial High School.
Ownership History
Date
Name
Owned For
Owner Type
Purchase Details
Closed on
Mar 8, 2022
Sold by
Baronas Michael J and Baronas Kathleen M
Bought by
Baronas Ft
Current Estimated Value
Purchase Details
Closed on
Aug 18, 1992
Sold by
George Allen & Son
Bought by
Baronas Michael J and Lawless Kathleen
Create a Home Valuation Report for This Property
The Home Valuation Report is an in-depth analysis detailing your home's value as well as a comparison with similar homes in the area
Home Values in the Area
Average Home Value in this Area
Purchase History
| Date | Buyer | Sale Price | Title Company |
|---|---|---|---|
| Baronas Ft | -- | None Available | |
| Baronas Michael J | $137,750 | -- |
Source: Public Records
Mortgage History
| Date | Status | Borrower | Loan Amount |
|---|---|---|---|
| Previous Owner | Baronas Michael J | $265,000 | |
| Previous Owner | Baronas Michael J | $60,000 | |
| Previous Owner | Baronas Michael J | $175,000 |
Source: Public Records
Tax History Compared to Growth
Tax History
| Year | Tax Paid | Tax Assessment Tax Assessment Total Assessment is a certain percentage of the fair market value that is determined by local assessors to be the total taxable value of land and additions on the property. | Land | Improvement |
|---|---|---|---|---|
| 2025 | $8,117 | $713,900 | $362,500 | $351,400 |
| 2024 | $7,622 | $675,100 | $327,300 | $347,800 |
| 2023 | $7,264 | $612,000 | $285,900 | $326,100 |
| 2022 | $6,628 | $524,400 | $251,100 | $273,300 |
| 2021 | $6,457 | $496,700 | $229,300 | $267,400 |
| 2020 | $6,322 | $486,700 | $220,600 | $266,100 |
| 2019 | $6,085 | $451,400 | $207,500 | $243,900 |
| 2018 | $5,902 | $415,900 | $187,900 | $228,000 |
| 2017 | $5,604 | $397,700 | $181,400 | $216,300 |
| 2016 | $5,543 | $392,000 | $175,700 | $216,300 |
| 2015 | $5,370 | $382,500 | $166,200 | $216,300 |
| 2014 | $5,503 | $385,100 | $165,800 | $219,300 |
Source: Public Records
Map
Nearby Homes
- 6 Edgehill Rd
- 7 Alder Way Unit 159
- 12 Springs Rd
- 7 Stonegate Ln Unit 134
- 43 Outlook Rd
- 63 Outlook Rd
- 332 North Rd
- 5 Chestnut Ln Unit 120
- 4 Dove Ln
- 34 Pickman Dr Unit 14
- 32 Marshall St
- 483 Middlesex Turnpike
- 198 Nashua Rd
- 481 Middlesex Turnpike
- 8 Water St
- 463 Middlesex Turnpike
- 454 Middlesex Turnpike
- 25 Pickman Dr Unit 25
- 267 Carlisle Rd
- 11 Kay's Walk