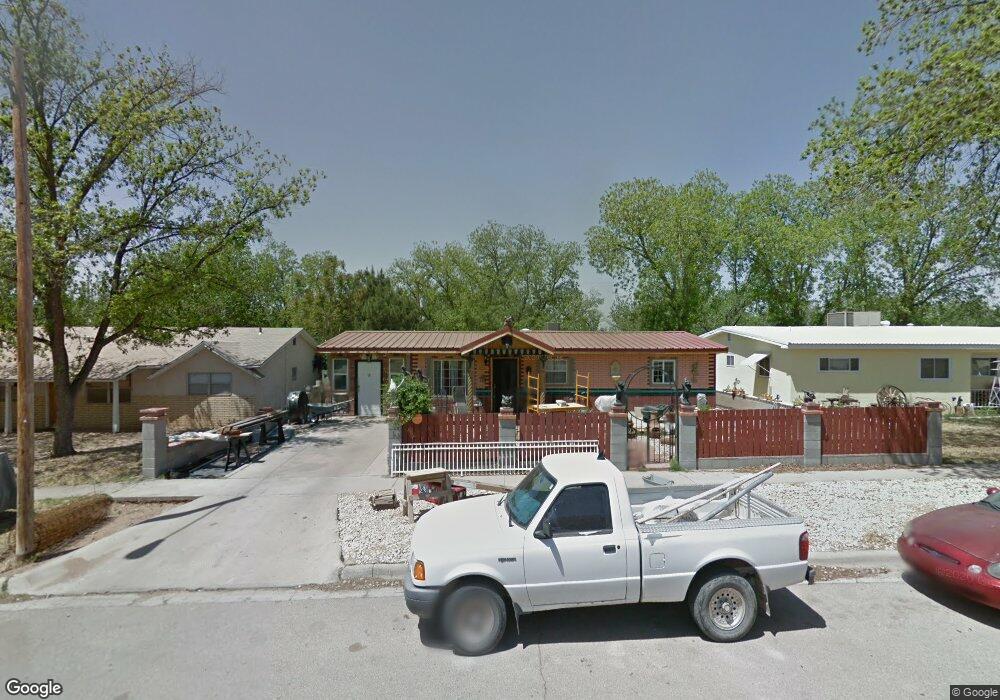
317 Nelson St Carlsbad, NM 88220
Estimated Value: $129,000 - $243,000
--
Bed
--
Bath
1,618
Sq Ft
$123/Sq Ft
Est. Value
About This Home
This home is located at 317 Nelson St, Carlsbad, NM 88220 and is currently estimated at $199,175, approximately $123 per square foot. 317 Nelson St is a home with nearby schools including Cottonwood Elementary School, Ocotillo Elementary School, and Carlsbad Intermediate School - PR Leyva Campus.
Ownership History
Date
Name
Owned For
Owner Type
Purchase Details
Closed on
Jun 12, 2023
Sold by
Ward Lou Jean
Bought by
Ward Lou Jean and Ward Patrick Leslie
Current Estimated Value
Purchase Details
Closed on
Oct 17, 2016
Sold by
Davis Francis P
Bought by
Ward Lou
Purchase Details
Closed on
Mar 5, 2014
Sold by
Davis Francis P
Bought by
Ward Lou
Purchase Details
Closed on
Apr 11, 2013
Sold by
Ward Lou Jean
Bought by
Ward Lou J and Davis Francis P
Home Financials for this Owner
Home Financials are based on the most recent Mortgage that was taken out on this home.
Original Mortgage
$91,199
Interest Rate
3.56%
Mortgage Type
Credit Line Revolving
Purchase Details
Closed on
Feb 28, 2012
Sold by
Aranda Frank and Tabor Josie Y
Bought by
Ward Lou
Purchase Details
Closed on
Jan 30, 2008
Sold by
Patrick Alexander B and Patrick Mariann
Bought by
Ward Lou Jean
Create a Home Valuation Report for This Property
The Home Valuation Report is an in-depth analysis detailing your home's value as well as a comparison with similar homes in the area
Home Values in the Area
Average Home Value in this Area
Purchase History
| Date | Buyer | Sale Price | Title Company |
|---|---|---|---|
| Ward Lou Jean | -- | None Listed On Document | |
| Ward Lou | -- | None Available | |
| Ward Lou | -- | None Available | |
| Ward Lou J | -- | Guaranty Title Company | |
| Ward Lou | -- | None Available | |
| Ward Lou Jean | -- | None Available | |
| Patrick Alexander B | -- | None Available |
Source: Public Records
Mortgage History
| Date | Status | Borrower | Loan Amount |
|---|---|---|---|
| Previous Owner | Ward Lou J | $91,199 |
Source: Public Records
Tax History Compared to Growth
Tax History
| Year | Tax Paid | Tax Assessment Tax Assessment Total Assessment is a certain percentage of the fair market value that is determined by local assessors to be the total taxable value of land and additions on the property. | Land | Improvement |
|---|---|---|---|---|
| 2024 | $1,081 | $45,429 | $1,200 | $44,229 |
| 2023 | $1,081 | $44,106 | $1,195 | $42,911 |
| 2022 | $1,009 | $42,822 | $1,190 | $41,632 |
| 2021 | $974 | $41,575 | $1,186 | $40,389 |
| 2020 | $956 | $40,364 | $1,182 | $39,182 |
| 2019 | $404 | $17,860 | $1,179 | $16,681 |
| 2018 | $389 | $17,340 | $1,179 | $16,161 |
| 2017 | $374 | $16,835 | $1,214 | $15,621 |
| 2015 | $375 | $0 | $0 | $0 |
| 2014 | $329 | $0 | $0 | $0 |
Source: Public Records
Map
Nearby Homes
- 705 S Halagueno St
- 31 N Canal St
- 503 Pompa St
- 802 E Greene St
- 408 Vela St
- 309 S Lake St
- 1828 Railroad Ave
- 414 S Mesa St
- 612 Riviera Ct
- 513 S Mesa St
- 307 N Mesquite St
- 904 Ortega St
- 713 Winged Foot Dr
- 911 W Fox St
- 402 Rosedale St
- 316 S Canal St
- 306 N Mesa St
- 805 Firestone Ct
- S of 2013 E Wood Ave
- S of 1102 E Wood Ave