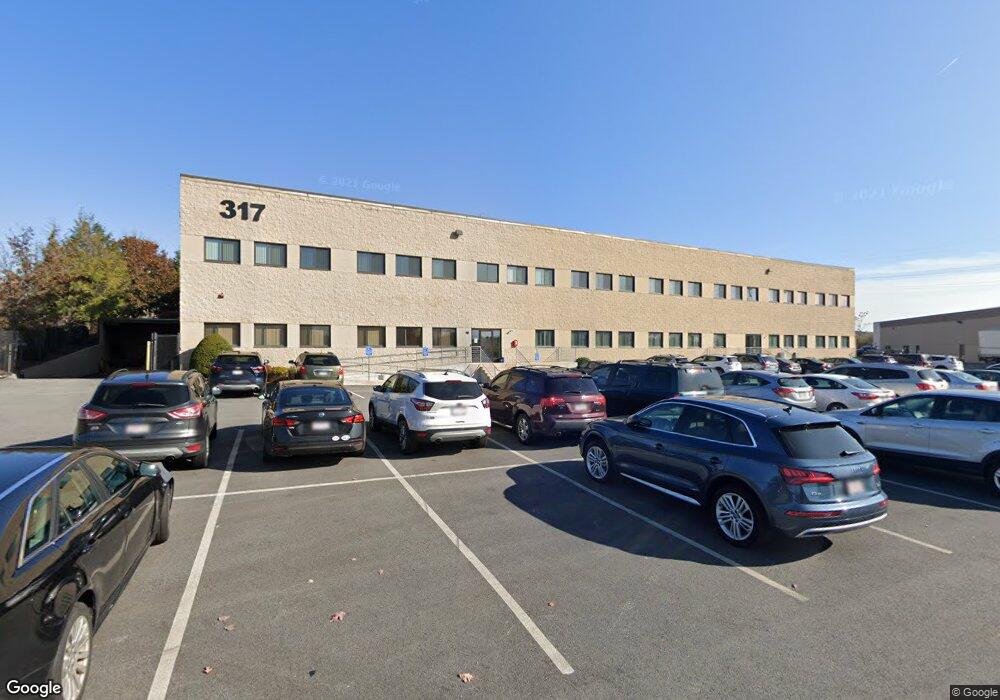
317 New Boston St Woburn, MA 01801
North Woburn Neighborhood
--
Bed
4
Baths
30,000
Sq Ft
3.76
Acres
About This Home
This home is located at 317 New Boston St, Woburn, MA 01801. 317 New Boston St is a home located in Middlesex County with nearby schools including Mary D. Altavesta Elementary School, John F. Kennedy Middle School, and Woburn High School.
Ownership History
Date
Name
Owned For
Owner Type
Purchase Details
Closed on
Aug 25, 2016
Sold by
Ram Cambridge Ventures
Bought by
317 Nb Development Llc
Home Financials for this Owner
Home Financials are based on the most recent Mortgage that was taken out on this home.
Original Mortgage
$4,000,000
Outstanding Balance
$3,194,019
Interest Rate
3.42%
Mortgage Type
Commercial
Purchase Details
Closed on
Feb 8, 1994
Sold by
Lawrence Svgs Bk
Bought by
Gillespie Paul S and Gillespie Jane L
Home Financials for this Owner
Home Financials are based on the most recent Mortgage that was taken out on this home.
Original Mortgage
$900,000
Interest Rate
7.12%
Mortgage Type
Commercial
Purchase Details
Closed on
Dec 8, 1989
Sold by
Sheehy Augustine
Bought by
317 New Boston St T
Home Financials for this Owner
Home Financials are based on the most recent Mortgage that was taken out on this home.
Original Mortgage
$2,400,000
Interest Rate
9.72%
Mortgage Type
Commercial
Create a Home Valuation Report for This Property
The Home Valuation Report is an in-depth analysis detailing your home's value as well as a comparison with similar homes in the area
Home Values in the Area
Average Home Value in this Area
Purchase History
| Date | Buyer | Sale Price | Title Company |
|---|---|---|---|
| 317 Nb Development Llc | -- | -- | |
| Gillespie Paul S | $1,200,000 | -- | |
| 317 New Boston St T | $2,200,000 | -- |
Source: Public Records
Mortgage History
| Date | Status | Borrower | Loan Amount |
|---|---|---|---|
| Open | 317 Nb Development Llc | $4,000,000 | |
| Previous Owner | 317 New Boston St T | $900,000 | |
| Previous Owner | 317 New Boston St T | $2,400,000 |
Source: Public Records
Tax History Compared to Growth
Tax History
| Year | Tax Paid | Tax Assessment Tax Assessment Total Assessment is a certain percentage of the fair market value that is determined by local assessors to be the total taxable value of land and additions on the property. | Land | Improvement |
|---|---|---|---|---|
| 2025 | $102,783 | $5,035,900 | $974,100 | $4,061,800 |
| 2024 | $95,514 | $4,843,500 | $974,100 | $3,869,400 |
| 2023 | $94,506 | $4,470,500 | $974,100 | $3,496,400 |
| 2022 | $94,527 | $4,151,400 | $974,100 | $3,177,300 |
| 2021 | $85,702 | $3,749,000 | $974,100 | $2,774,900 |
| 2020 | $86,977 | $3,749,000 | $974,100 | $2,774,900 |
| 2019 | $84,827 | $3,576,200 | $974,100 | $2,602,100 |
| 2018 | $84,513 | $3,387,300 | $1,026,200 | $2,361,100 |
| 2017 | $75,467 | $3,022,300 | $1,026,200 | $1,996,100 |
| 2016 | $75,186 | $2,915,300 | $1,026,200 | $1,889,100 |
| 2015 | $71,163 | $2,705,800 | $546,700 | $2,159,100 |
| 2014 | $54,995 | $2,006,400 | $546,700 | $1,459,700 |
Source: Public Records
Map
Nearby Homes
- 83 Merrimac St
- 2 Inwood Dr Unit 1010
- 39 Taylor Dr Unit 2006
- 16 Taylor Dr Unit 1009
- 18 Talbot Ln Unit 18
- 26 E Dexter Ave
- 27 Green Meadow Dr
- 112 Johnson Woods Dr Unit 102
- 141 Johnson Woods Dr
- 144 Johnson Woods Dr
- 75 Johnson Woods Dr Unit 75
- 16 Munroe Ave
- 203 Lowell St Unit 120
- 203 Lowell St Unit 206
- 203 Lowell St Unit 115
- 203 Lowell St Unit 119
- 203 Lowell St Unit 304
- 17 Palmer Hill Ave
- 57 Wescroft Rd
- 452 Lowell St
- 323 New Boston St Unit 2
- 325 New Boston St Unit 17
- 325 New Boston St Unit 13
- 325 New Boston St Unit 10
- 316 New Boston St
- 1 Presidential Way Unit 103
- 1 Presidential Way Unit 104-A
- 1 Presidential Way Unit 106
- 1 Presidential Way Unit 104B
- 1 Presidential Way
- 223 New Boston St
- 4 Presidential Way
- 25 Industrial Way
- 845 Woburn St Unit F
- 845 Woburn St Unit 2
- 845 Woburn St
- Lot 26 Atlantic Ave Unit 14
- 20 Atlantic Ave
- 23 Cook Ave
- 120 Commerce Way