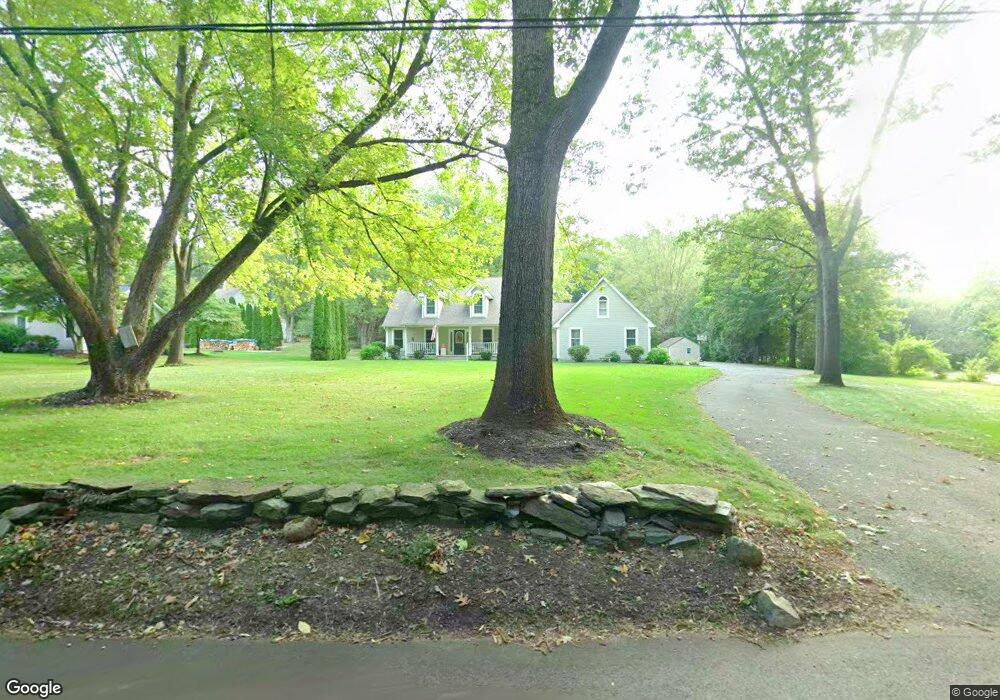
317 River Rd South Hadley, MA 01075
Estimated Value: $488,063 - $552,000
3
Beds
3
Baths
1,891
Sq Ft
$272/Sq Ft
Est. Value
About This Home
This home is located at 317 River Rd, South Hadley, MA 01075 and is currently estimated at $515,266, approximately $272 per square foot. 317 River Rd is a home located in Hampshire County with nearby schools including Plains Elementary School, Mosier Elementary School, and Michael E. Smith Middle School.
Ownership History
Date
Name
Owned For
Owner Type
Purchase Details
Closed on
May 8, 2018
Sold by
Ginley Michael J and Ginley Madelyn J
Bought by
Blaney Daniel R and Blaney Elizabeth N
Current Estimated Value
Home Financials for this Owner
Home Financials are based on the most recent Mortgage that was taken out on this home.
Original Mortgage
$200,000
Outstanding Balance
$172,405
Interest Rate
4.45%
Mortgage Type
New Conventional
Estimated Equity
$342,861
Purchase Details
Closed on
Feb 2, 1998
Sold by
Plotnikiewicz Jack and Plotnikiewicz Lori A
Bought by
Ginley Madelyn J and Ginley Michael J
Home Financials for this Owner
Home Financials are based on the most recent Mortgage that was taken out on this home.
Original Mortgage
$143,000
Interest Rate
7.02%
Mortgage Type
Purchase Money Mortgage
Create a Home Valuation Report for This Property
The Home Valuation Report is an in-depth analysis detailing your home's value as well as a comparison with similar homes in the area
Home Values in the Area
Average Home Value in this Area
Purchase History
| Date | Buyer | Sale Price | Title Company |
|---|---|---|---|
| Blaney Daniel R | $345,000 | -- | |
| Ginley Madelyn J | $215,000 | -- |
Source: Public Records
Mortgage History
| Date | Status | Borrower | Loan Amount |
|---|---|---|---|
| Open | Blaney Daniel R | $200,000 | |
| Previous Owner | Ginley Madelyn J | $143,000 | |
| Previous Owner | Ginley Madelyn J | $18,300 | |
| Previous Owner | Ginley Madelyn J | $150,000 | |
| Closed | Ginley Madelyn J | $61,250 |
Source: Public Records
Tax History Compared to Growth
Tax History
| Year | Tax Paid | Tax Assessment Tax Assessment Total Assessment is a certain percentage of the fair market value that is determined by local assessors to be the total taxable value of land and additions on the property. | Land | Improvement |
|---|---|---|---|---|
| 2025 | $6,499 | $408,000 | $122,800 | $285,200 |
| 2024 | $6,344 | $381,000 | $115,000 | $266,000 |
| 2023 | $5,720 | $325,900 | $104,100 | $221,800 |
| 2022 | $5,439 | $294,300 | $104,100 | $190,200 |
| 2021 | $5,369 | $275,900 | $97,600 | $178,300 |
| 2020 | $5,226 | $262,100 | $97,600 | $164,500 |
| 2019 | $6,710 | $333,000 | $92,800 | $240,200 |
| 2018 | $6,427 | $322,500 | $90,200 | $232,300 |
| 2017 | $6,145 | $305,400 | $90,200 | $215,200 |
| 2016 | $6,235 | $314,100 | $90,200 | $223,900 |
| 2015 | $5,911 | $305,000 | $87,600 | $217,400 |
Source: Public Records
Map
Nearby Homes
- 10 Radcliffe St
- 17 Cleveland St
- 77 Central Park Dr
- 31 Wellesley Rd
- 119 Central Park Dr
- 1 White Brook Ln
- 1212 Northampton St
- 22 Liberty St
- 211 Pleasant St
- 141 Dartmouth St
- 50 Nonotuck St
- 4 Claren Dr
- 41 W Summit St Unit 38
- 41 W Summit St Unit 72
- 41 W Summit St Unit 32
- 41 W Summit St Unit 55
- 47 Pynchon Rd
- 129 Morgan St
- 102 W Meadowview Rd
- 11 Longfellow Rd