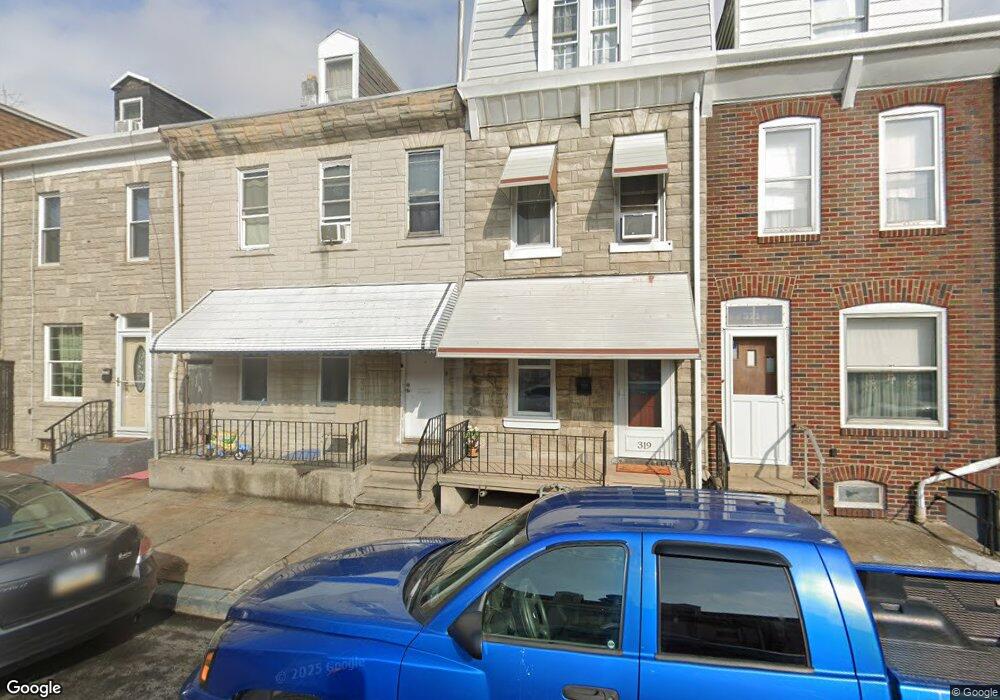
317 S 11th St Reading, PA 19602
Southeast Community NeighborhoodEstimated Value: $128,443 - $184,000
5
Beds
1
Bath
2,044
Sq Ft
$77/Sq Ft
Est. Value
About This Home
This home is located at 317 S 11th St, Reading, PA 19602 and is currently estimated at $156,861, approximately $76 per square foot. 317 S 11th St is a home located in Berks County with nearby schools including Amanda E. Stout Elementary School, Southern Middle School, and Reading Senior High School.
Ownership History
Date
Name
Owned For
Owner Type
Purchase Details
Closed on
Jul 19, 2022
Sold by
Brunner Brian T
Bought by
M Creative Homes Llc
Current Estimated Value
Home Financials for this Owner
Home Financials are based on the most recent Mortgage that was taken out on this home.
Original Mortgage
$90,000
Outstanding Balance
$85,779
Interest Rate
5.3%
Mortgage Type
Balloon
Estimated Equity
$71,082
Purchase Details
Closed on
Oct 3, 2011
Sold by
Us Bank National Association
Bought by
Brunner Veda D
Purchase Details
Closed on
Sep 24, 2001
Sold by
Bonsall Walter J and Bonsall Edna J
Bought by
Brunner Brian T
Home Financials for this Owner
Home Financials are based on the most recent Mortgage that was taken out on this home.
Original Mortgage
$34,966
Interest Rate
6.89%
Mortgage Type
FHA
Create a Home Valuation Report for This Property
The Home Valuation Report is an in-depth analysis detailing your home's value as well as a comparison with similar homes in the area
Home Values in the Area
Average Home Value in this Area
Purchase History
| Date | Buyer | Sale Price | Title Company |
|---|---|---|---|
| M Creative Homes Llc | $78,000 | None Listed On Document | |
| Brunner Veda D | $16,900 | None Available | |
| Brunner Brian T | $34,900 | -- |
Source: Public Records
Mortgage History
| Date | Status | Borrower | Loan Amount |
|---|---|---|---|
| Open | M Creative Homes Llc | $90,000 | |
| Previous Owner | Brunner Brian T | $34,966 |
Source: Public Records
Tax History Compared to Growth
Tax History
| Year | Tax Paid | Tax Assessment Tax Assessment Total Assessment is a certain percentage of the fair market value that is determined by local assessors to be the total taxable value of land and additions on the property. | Land | Improvement |
|---|---|---|---|---|
| 2025 | $985 | $36,300 | $7,100 | $29,200 |
| 2024 | $1,612 | $36,300 | $7,100 | $29,200 |
| 2023 | $1,587 | $36,300 | $7,100 | $29,200 |
| 2022 | $1,587 | $36,300 | $7,100 | $29,200 |
| 2021 | $1,587 | $36,300 | $7,100 | $29,200 |
| 2020 | $1,571 | $36,300 | $7,100 | $29,200 |
| 2019 | $1,571 | $36,300 | $7,100 | $29,200 |
| 2018 | $1,571 | $36,300 | $7,100 | $29,200 |
| 2017 | $1,561 | $36,300 | $7,100 | $29,200 |
| 2016 | $892 | $36,300 | $7,100 | $29,200 |
| 2015 | $892 | $36,300 | $7,100 | $29,200 |
| 2014 | $820 | $36,300 | $7,100 | $29,200 |
Source: Public Records
Map
Nearby Homes
- 236 Wunder St
- 1052 Spruce St
- 402 S 11th St
- 1053 Muhlenberg St
- 1101 Chestnut St
- 1242 Muhlenberg St
- 316 S 10th St
- 522 S 12th St
- 144 S 12th St
- 526 A S 11th St
- 541 S 11th St
- 223 S 13th St
- 122 Maple St
- 234 Orange St
- 933 Cotton St
- 1330 Perkiomen Ave
- 1364 Perkiomen Ave
- 42 Maple St
- 1322 Kenny St
- 830 Bingaman St