317 S Main St Randolph, MA 02368
South Randolph NeighborhoodEstimated Value: $588,000 - $672,000
3
Beds
3
Baths
1,508
Sq Ft
$427/Sq Ft
Est. Value
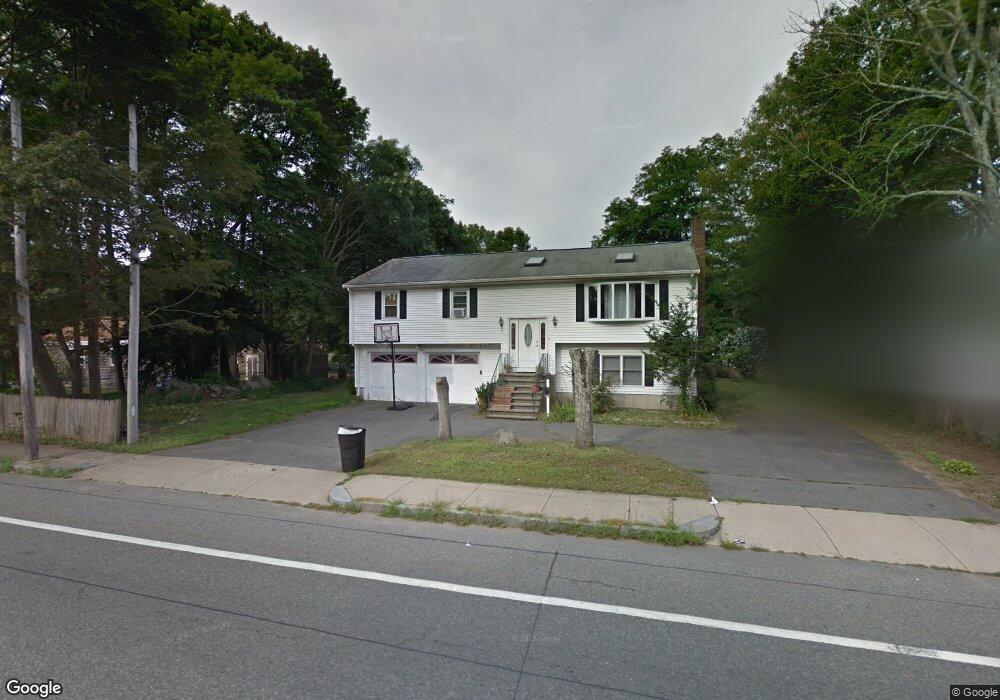
About This Home
This home is located at 317 S Main St, Randolph, MA 02368 and is currently estimated at $644,391, approximately $427 per square foot. 317 S Main St is a home located in Norfolk County with nearby schools including Randolph High School and Lighthouse Baptist Christian Academy.
Ownership History
Date
Name
Owned For
Owner Type
Purchase Details
Closed on
Aug 4, 1999
Sold by
Preble Ronald O and Preble Joan P
Bought by
Chen George and Chen Shu W
Current Estimated Value
Purchase Details
Closed on
Jun 11, 1993
Sold by
Scott Earl F
Bought by
Preble Ronald O and Preble Joan P
Purchase Details
Closed on
Dec 23, 1992
Sold by
Scott Earl F
Bought by
Preble Ronald O and Preble Joan P
Create a Home Valuation Report for This Property
The Home Valuation Report is an in-depth analysis detailing your home's value as well as a comparison with similar homes in the area
Home Values in the Area
Average Home Value in this Area
Purchase History
| Date | Buyer | Sale Price | Title Company |
|---|---|---|---|
| Chen George | $203,000 | -- | |
| Preble Ronald O | $50,000 | -- | |
| Preble Ronald O | $50,000 | -- |
Source: Public Records
Mortgage History
| Date | Status | Borrower | Loan Amount |
|---|---|---|---|
| Open | Preble Ronald O | $11,000 | |
| Open | Preble Ronald O | $243,750 |
Source: Public Records
Tax History Compared to Growth
Tax History
| Year | Tax Paid | Tax Assessment Tax Assessment Total Assessment is a certain percentage of the fair market value that is determined by local assessors to be the total taxable value of land and additions on the property. | Land | Improvement |
|---|---|---|---|---|
| 2025 | $6,944 | $598,100 | $230,700 | $367,400 |
| 2024 | $6,814 | $595,100 | $226,100 | $369,000 |
| 2023 | $6,453 | $534,200 | $205,700 | $328,500 |
| 2022 | $6,226 | $457,800 | $171,400 | $286,400 |
| 2021 | $6,029 | $407,900 | $142,800 | $265,100 |
| 2020 | $5,848 | $392,200 | $142,800 | $249,400 |
| 2019 | $5,773 | $385,400 | $136,000 | $249,400 |
| 2018 | $5,995 | $377,500 | $123,700 | $253,800 |
| 2017 | $5,540 | $342,400 | $117,700 | $224,700 |
| 2016 | $5,387 | $309,800 | $107,000 | $202,800 |
| 2015 | $5,269 | $291,100 | $102,000 | $189,100 |
Source: Public Records
Map
Nearby Homes
- 20 Selwyn Rd
- 24 Cole Terrace
- 4 Lori Ln
- 15 Barbara Rd
- 65 Lheureux Cir
- 40 Linden Park Dr
- 9 Madison Ave
- 46 Union Square Unit 46
- 5 Patterson Ave E
- 314 South St
- 43 Toscano Way Unit 43
- 30 Hemlock Terrace
- 346 South St
- 4 Evan Cain Way
- 7 Oakwood Ave
- 0 Payson Ave
- 59 Highland Glen Dr Unit 328
- 15 Payson Ave
- 89 Fernandez Cir
- 58 Woodlawn Rd