Estimated Value: $384,000 - $404,000
4
Beds
3
Baths
2,291
Sq Ft
$172/Sq Ft
Est. Value
About This Home
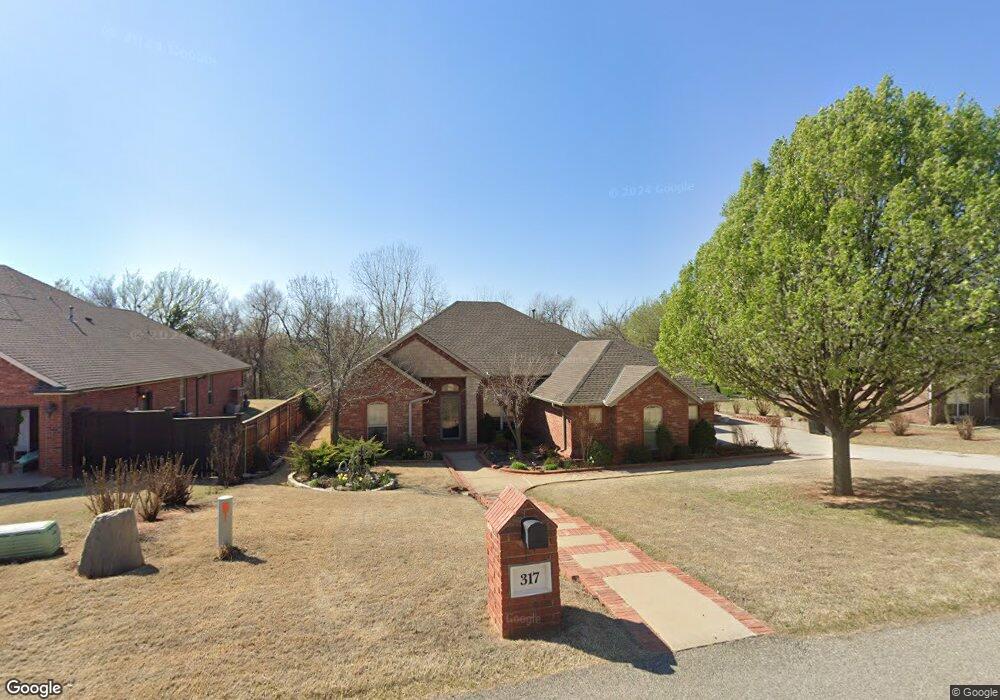
This home is located at 317 S Wyndemere Springs, Moore, OK 73160 and is currently estimated at $393,942, approximately $171 per square foot. 317 S Wyndemere Springs is a home located in Cleveland County with nearby schools including Heritage Trails Elementary School, Highland East Junior High School, and Moore High School.
Ownership History
Date
Name
Owned For
Owner Type
Purchase Details
Closed on
May 15, 2019
Sold by
Davis James W and Davis Regenia Ann
Bought by
Davis James W and Davis Regenia Ann
Current Estimated Value
Purchase Details
Closed on
May 18, 2006
Sold by
Nelson Jason M and Nelson Sami Rae
Bought by
Davis James Wayne and Davis Regenia Ann
Home Financials for this Owner
Home Financials are based on the most recent Mortgage that was taken out on this home.
Original Mortgage
$188,800
Outstanding Balance
$109,345
Interest Rate
6.4%
Mortgage Type
New Conventional
Estimated Equity
$284,597
Purchase Details
Closed on
Mar 25, 2005
Sold by
Mym Torb Inc
Bought by
Nelson Jason M
Home Financials for this Owner
Home Financials are based on the most recent Mortgage that was taken out on this home.
Original Mortgage
$219,900
Interest Rate
6.25%
Mortgage Type
Adjustable Rate Mortgage/ARM
Purchase Details
Closed on
May 4, 2004
Sold by
North Fork Development Llc
Bought by
Mym Torb, Inc
Create a Home Valuation Report for This Property
The Home Valuation Report is an in-depth analysis detailing your home's value as well as a comparison with similar homes in the area
Home Values in the Area
Average Home Value in this Area
Purchase History
| Date | Buyer | Sale Price | Title Company |
|---|---|---|---|
| Davis James W | -- | None Available | |
| Davis James Wayne | $236,000 | None Available | |
| Nelson Jason M | $220,000 | None Available | |
| Mym Torb, Inc | $27,000 | -- |
Source: Public Records
Mortgage History
| Date | Status | Borrower | Loan Amount |
|---|---|---|---|
| Open | Davis James Wayne | $188,800 | |
| Previous Owner | Nelson Jason M | $219,900 |
Source: Public Records
Tax History Compared to Growth
Tax History
| Year | Tax Paid | Tax Assessment Tax Assessment Total Assessment is a certain percentage of the fair market value that is determined by local assessors to be the total taxable value of land and additions on the property. | Land | Improvement |
|---|---|---|---|---|
| 2024 | $4,192 | $34,554 | $7,689 | $26,865 |
| 2023 | $4,010 | $32,909 | $7,583 | $25,326 |
| 2022 | $3,878 | $31,342 | $7,242 | $24,100 |
| 2021 | $3,709 | $29,849 | $4,320 | $25,529 |
| 2020 | $3,711 | $29,849 | $4,320 | $25,529 |
| 2019 | $3,653 | $29,849 | $4,320 | $25,529 |
| 2018 | $3,655 | $29,850 | $4,320 | $25,530 |
| 2017 | $3,594 | $29,850 | $0 | $0 |
| 2016 | $3,511 | $28,378 | $4,107 | $24,271 |
| 2015 | $3,080 | $27,552 | $4,320 | $23,232 |
| 2014 | $3,063 | $26,796 | $3,120 | $23,676 |
Source: Public Records
Map
Nearby Homes
- 401 S Bryant Ave
- 1809 Parkway Dr
- 2100 SE 5th St
- 112 Wellington Ln
- 705 Cottonwood Dr
- 908 Cottonwood Dr
- 104 S Ramblin Oaks Dr
- 604 Loyd Ln
- 609 Madeline Ln
- 1009 Ashwood Ln
- 2621 SE 5th St
- 204 S Morgan Dr
- 205 N Ramblin Oaks Dr
- 416 S English St
- 930 Estell Dr
- 2224 NE 8th St
- 1013 Kelsi Dr
- 2625 SE 8th St
- 1105 Spruce Dr
- 1712 SE 12th St
- 321 S Wyndemere Springs
- 313 S Wyndemere Springs
- 309 S Wyndemere Springs
- 325 S Wyndemere Springs
- 308 S Wyndemere Springs
- 305 S Wyndemere Springs
- 2100 SE 3rd St
- 2104 SE 3rd St
- 304 S Wyndemere Springs
- 0 SE 3rd St
- 2109 SE 3rd St
- 301 S Wyndemere Springs
- 1828 Parkway Dr
- 2108 SE 3rd St
- 405 S Bryant Ave
- 1821 Parkway Dr
- 208 S Bryant Ave
- 1820 Parkway Dr
- 409 S Bryant Ave
- 1824 SE 2nd St