Estimated Value: $266,000 - $299,000
3
Beds
2
Baths
1,520
Sq Ft
$183/Sq Ft
Est. Value
About This Home
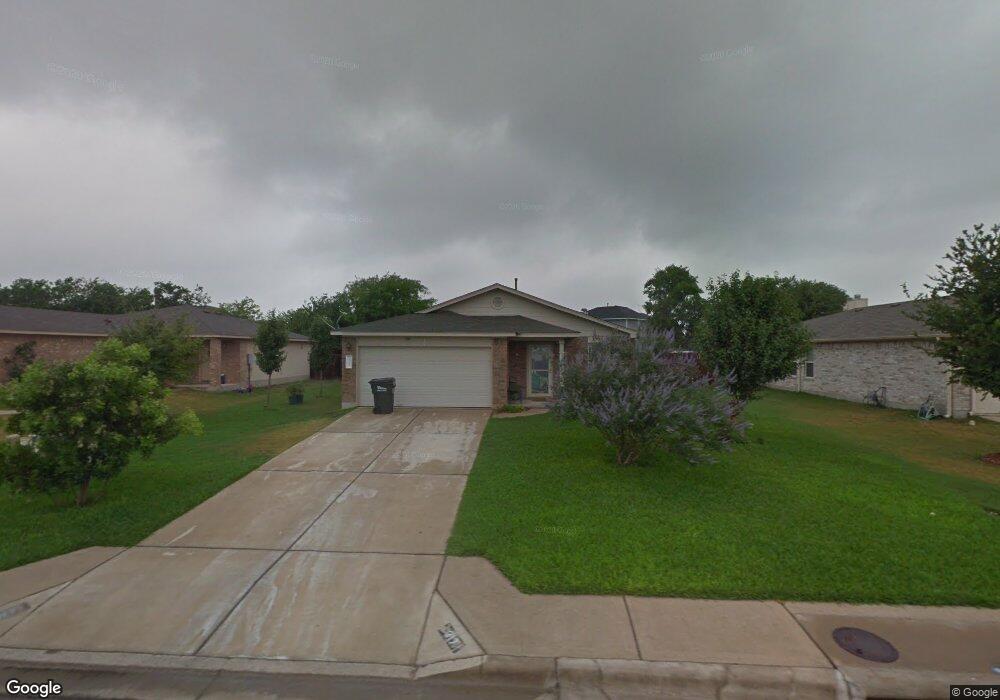
This home is located at 317 Spring Branch Loop, Kyle, TX 78640 and is currently estimated at $278,133, approximately $182 per square foot. 317 Spring Branch Loop is a home located in Hays County with nearby schools including Kyle Elementary School, R C Barton Middle School, and Jack C Hays High School.
Ownership History
Date
Name
Owned For
Owner Type
Purchase Details
Closed on
Mar 14, 2007
Sold by
Hud
Bought by
Rayos Rogelio Alfonso and Rayos Becky
Current Estimated Value
Home Financials for this Owner
Home Financials are based on the most recent Mortgage that was taken out on this home.
Original Mortgage
$112,500
Outstanding Balance
$68,318
Interest Rate
6.32%
Mortgage Type
Purchase Money Mortgage
Estimated Equity
$209,815
Purchase Details
Closed on
Nov 13, 2006
Sold by
Wells Fargo Bank Na
Bought by
Rayos Rogelio and Rayos Becky
Purchase Details
Closed on
Nov 7, 2006
Sold by
Mccauley Karen Elizabeth
Bought by
Rayos Rogelio and Rayos Becky
Purchase Details
Closed on
Jun 30, 2004
Sold by
Centex Homes
Bought by
Mccauley Karen Elizabeth
Home Financials for this Owner
Home Financials are based on the most recent Mortgage that was taken out on this home.
Original Mortgage
$119,008
Interest Rate
6.31%
Mortgage Type
Purchase Money Mortgage
Create a Home Valuation Report for This Property
The Home Valuation Report is an in-depth analysis detailing your home's value as well as a comparison with similar homes in the area
Home Values in the Area
Average Home Value in this Area
Purchase History
| Date | Buyer | Sale Price | Title Company |
|---|---|---|---|
| Rayos Rogelio Alfonso | -- | Fatco | |
| Rayos Rogelio | -- | -- | |
| Hud | -- | None Available | |
| Rayos Rogelio | -- | -- | |
| Wells Fargo Bank Na | $125,156 | None Available | |
| Mccauley Karen Elizabeth | -- | Commerce Title Company |
Source: Public Records
Mortgage History
| Date | Status | Borrower | Loan Amount |
|---|---|---|---|
| Open | Rayos Rogelio Alfonso | $112,500 | |
| Previous Owner | Mccauley Karen Elizabeth | $119,008 |
Source: Public Records
Tax History
| Year | Tax Paid | Tax Assessment Tax Assessment Total Assessment is a certain percentage of the fair market value that is determined by local assessors to be the total taxable value of land and additions on the property. | Land | Improvement |
|---|---|---|---|---|
| 2025 | -- | $288,670 | $70,800 | $217,870 |
| 2024 | $65 | $288,255 | $70,800 | $256,740 |
| 2023 | $5,854 | $262,050 | $70,800 | $253,680 |
| 2022 | $5,798 | $238,227 | $60,000 | $243,030 |
| 2021 | $5,746 | $216,570 | $37,500 | $179,070 |
| 2019 | $5,230 | $189,320 | $25,000 | $164,320 |
| 2018 | $4,803 | $173,413 | $18,380 | $161,490 |
| 2017 | $4,444 | $157,648 | $18,380 | $147,710 |
| 2016 | $4,040 | $143,316 | $17,630 | $136,030 |
| 2015 | $2,786 | $131,373 | $17,000 | $122,480 |
Source: Public Records
Map
Nearby Homes
- 321 Spring Branch Loop
- 313 Spring Branch Loop
- 325 Spring Branch Loop
- 177 Keegans Way
- 138 Caraway
- 142 Caraway
- 305 Spring Branch Loop
- 312 Spring Branch Loop
- 329 Spring Branch Loop
- 562 Hogan
- 169 Keegans Way
- 552 Hogan
- 306 Spring Branch Loop
- 302 Spring Branch Loop
- 544 Hogan
- 301 Spring Branch Loop
- 333 Spring Branch Loop
- 328 Spring Branch Loop
Your Personal Tour Guide
Ask me questions while you tour the home.